Eidolon Fate of Fools
Technical Level Designer
Gameplay Programmer
Details
- 9 Person Team
- Built in Unreal Engine 5.4
- Academic Game Project
- August 2024 - Present
My Contributions
- Engineered C++ and Blueprint scripts to visualize telemetry data for grid-based heatmap analysis of player fps and level metrics.
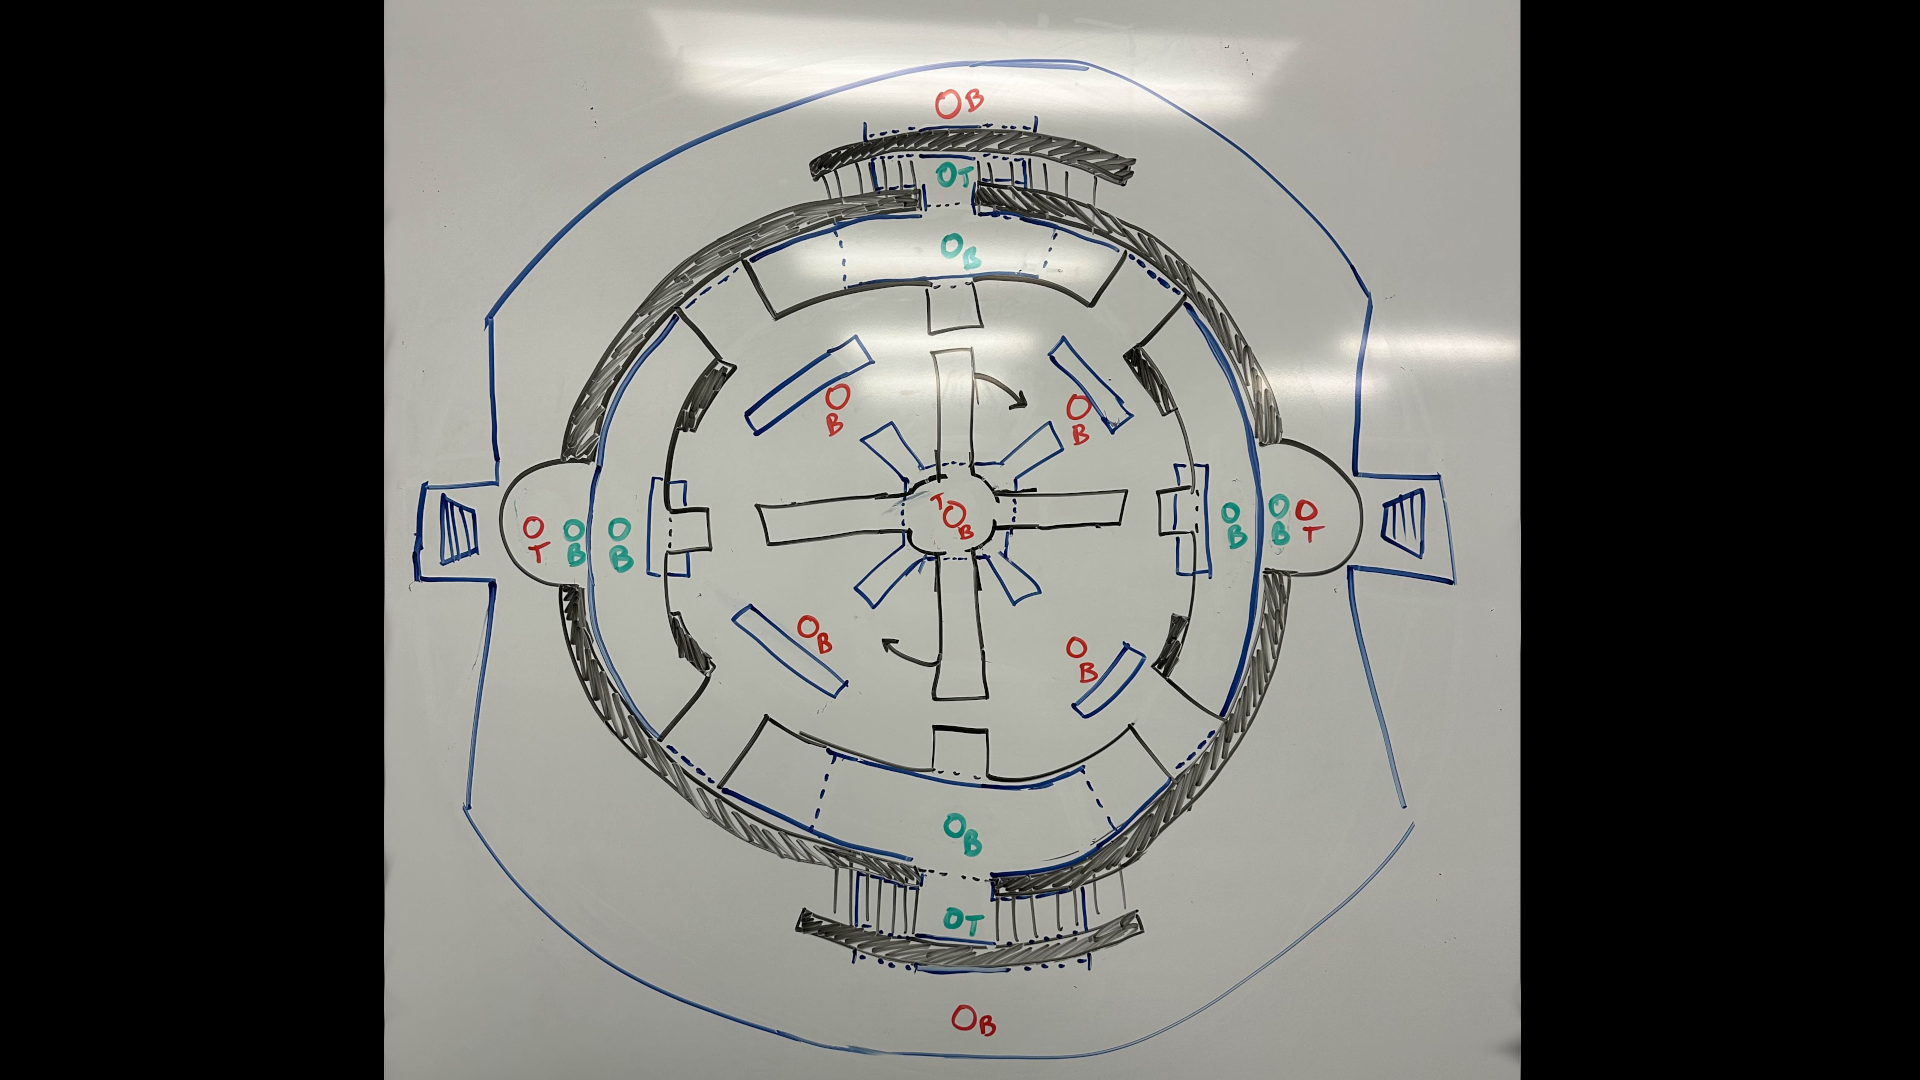
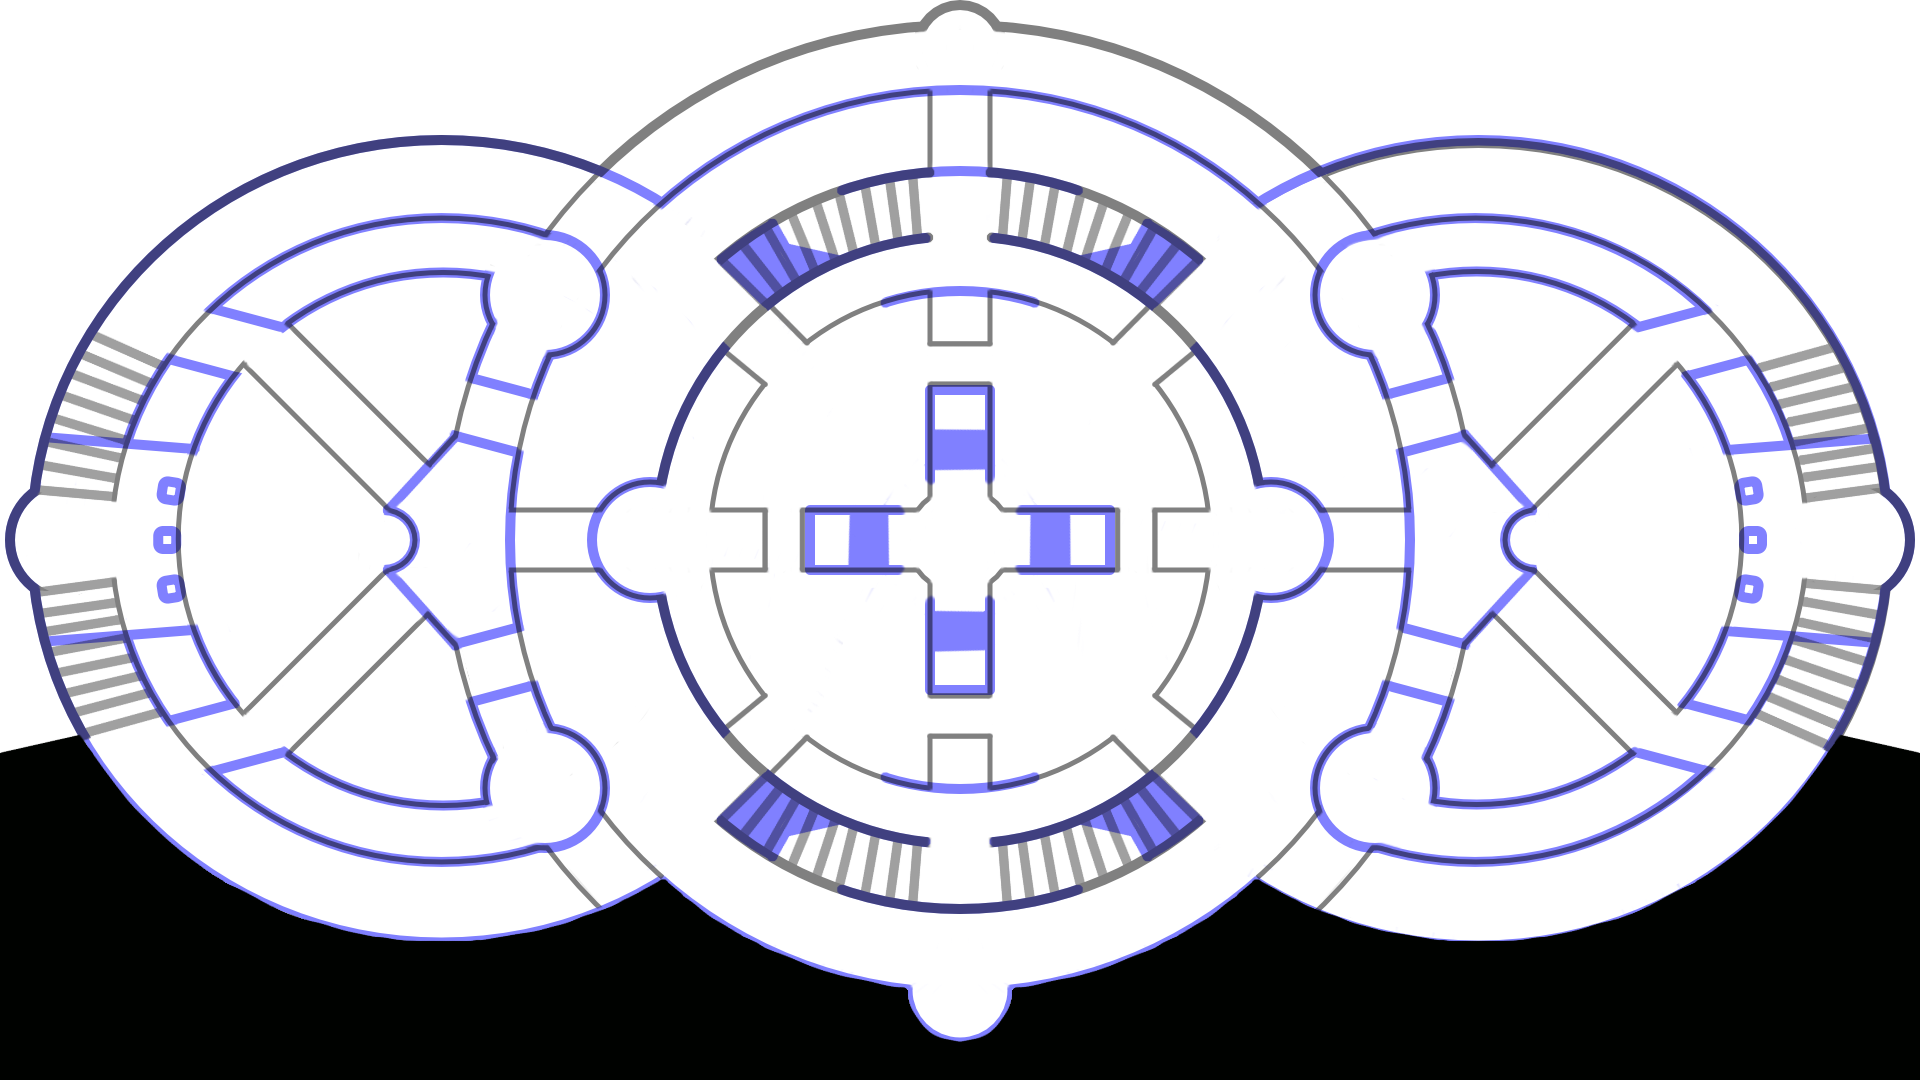
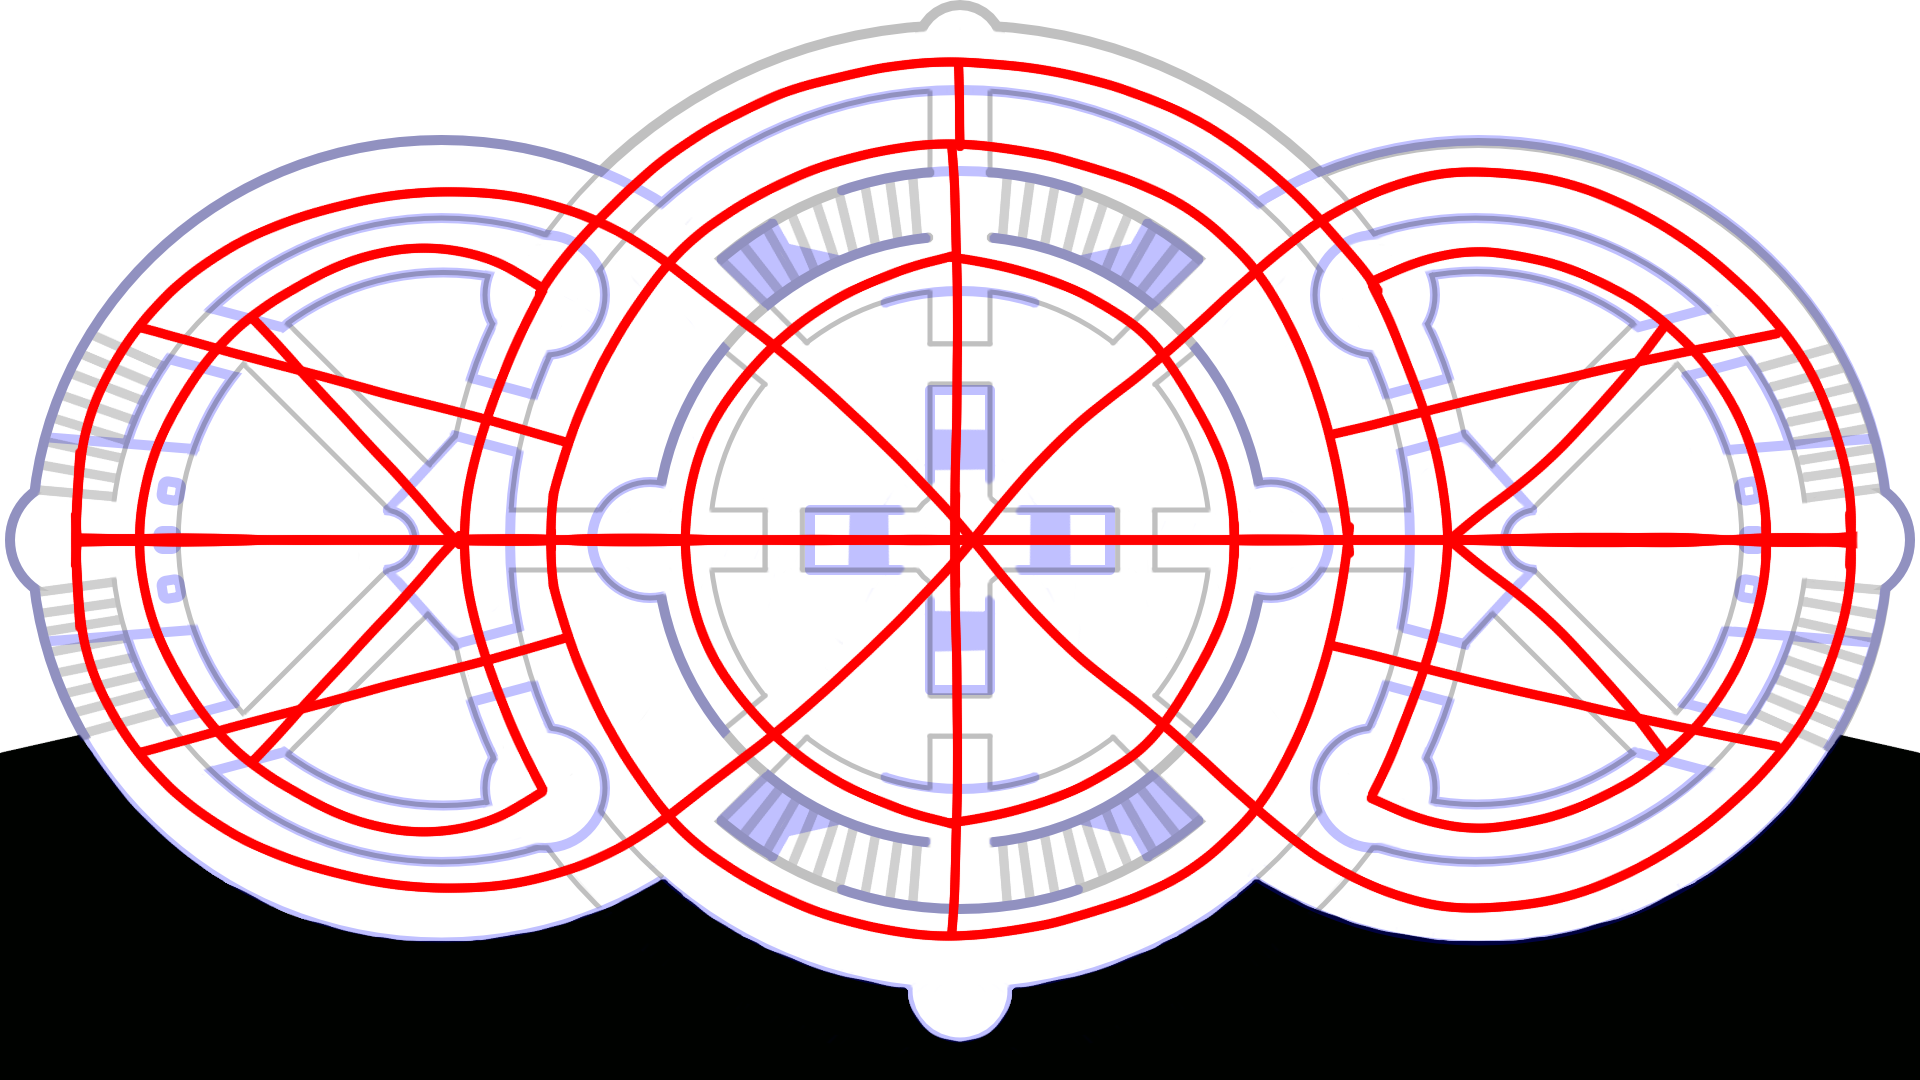
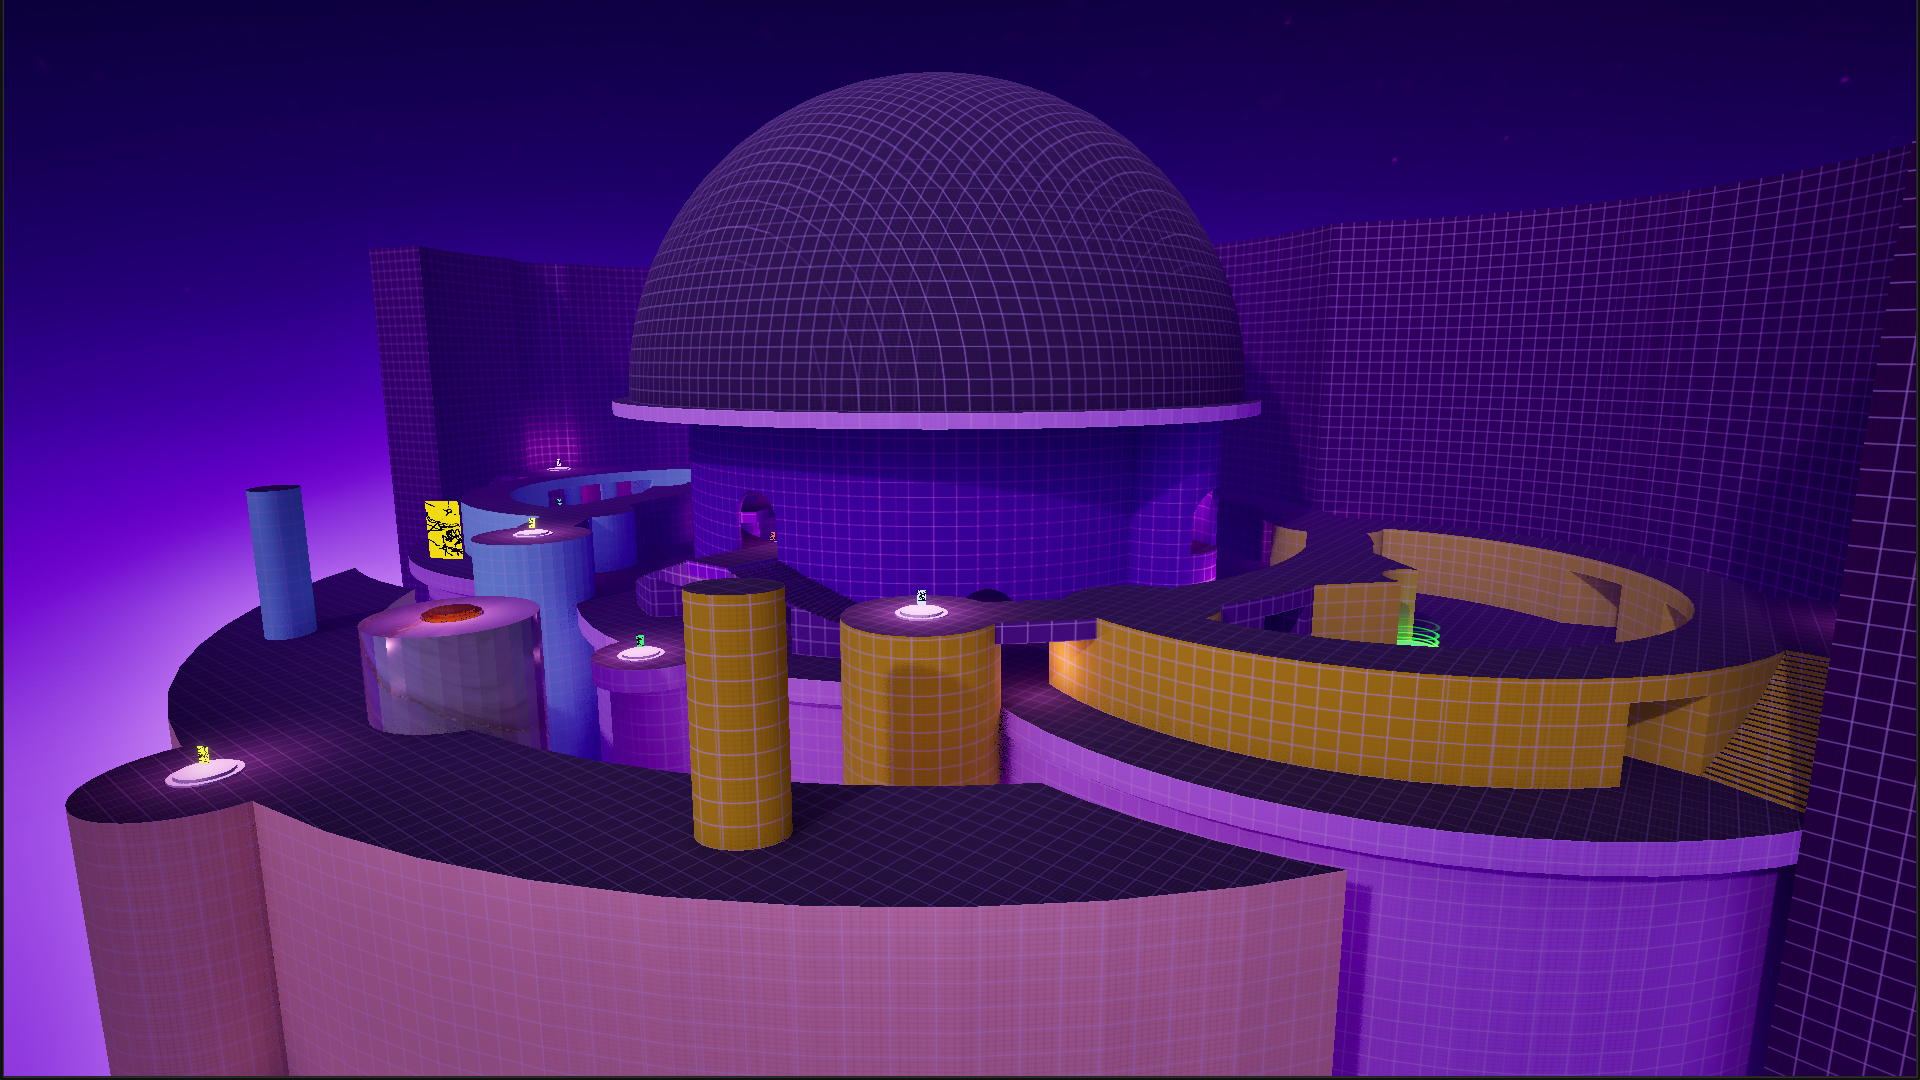
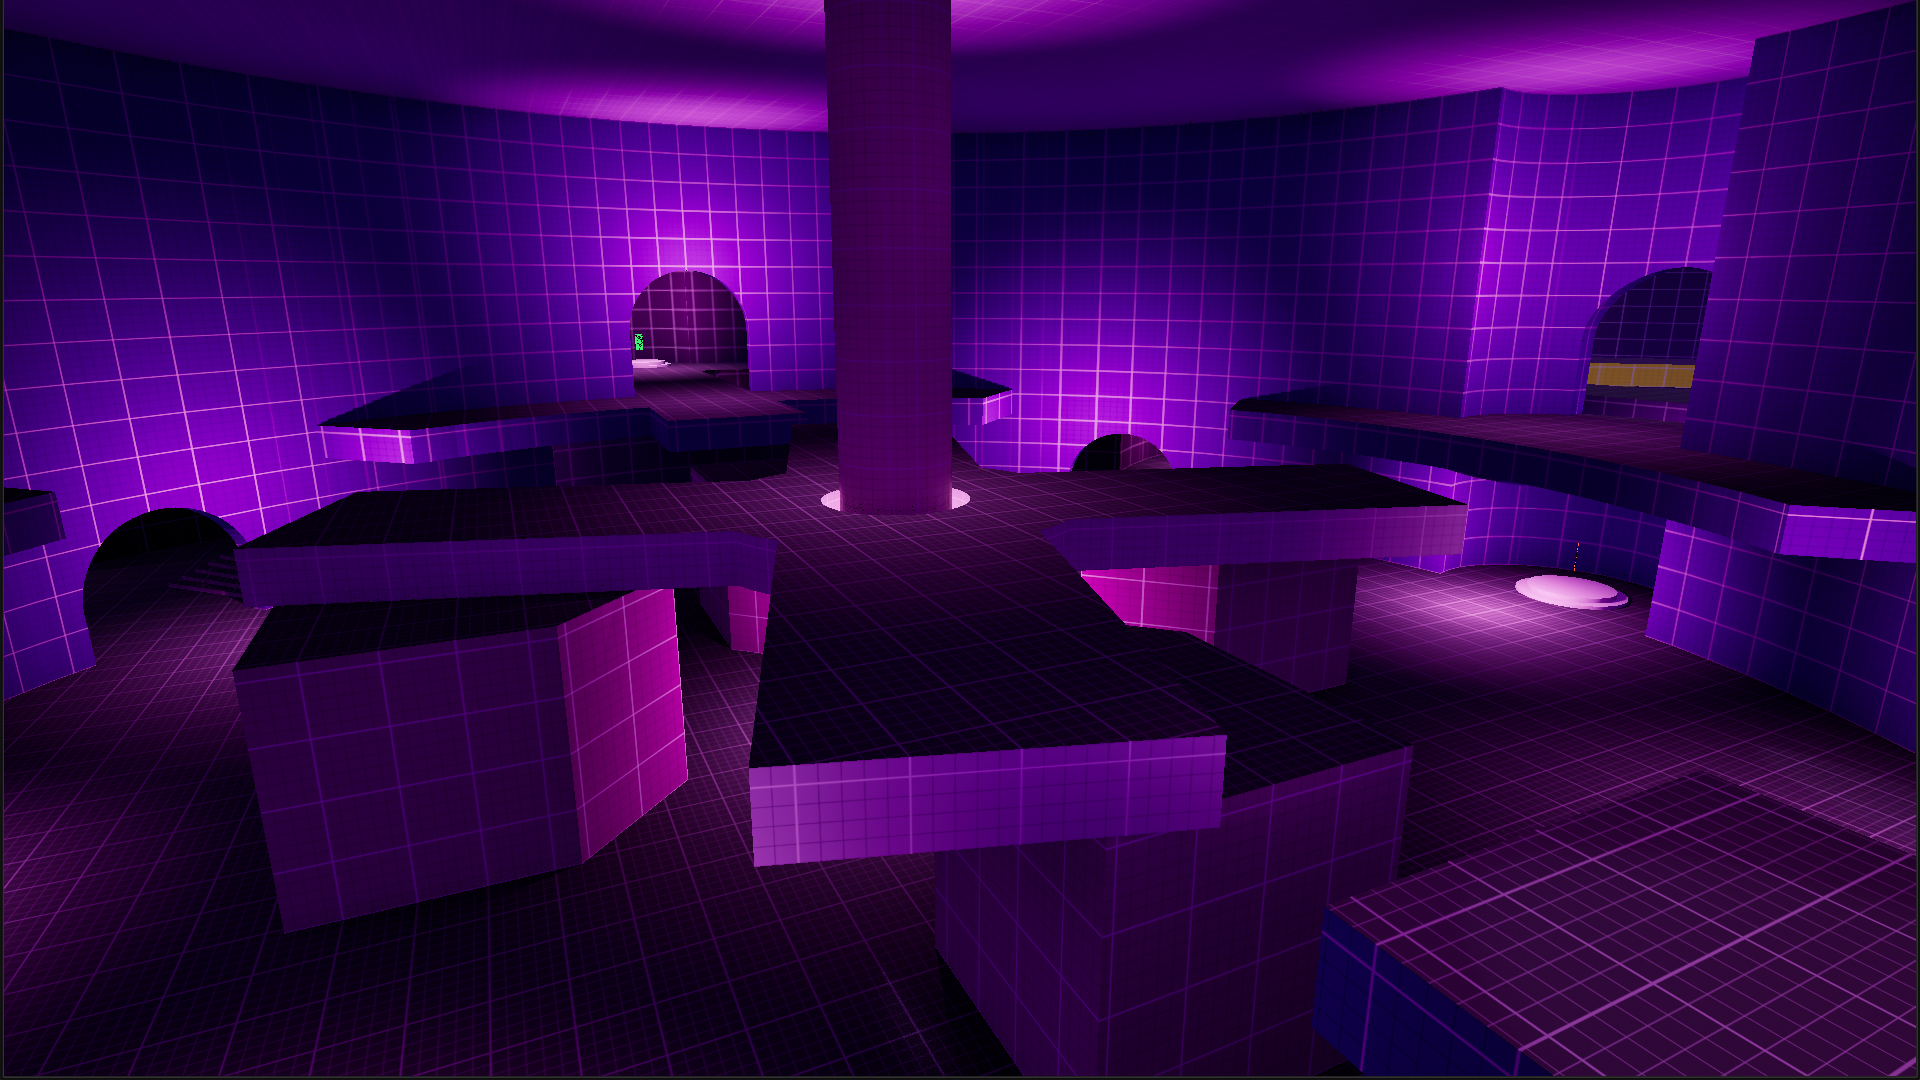
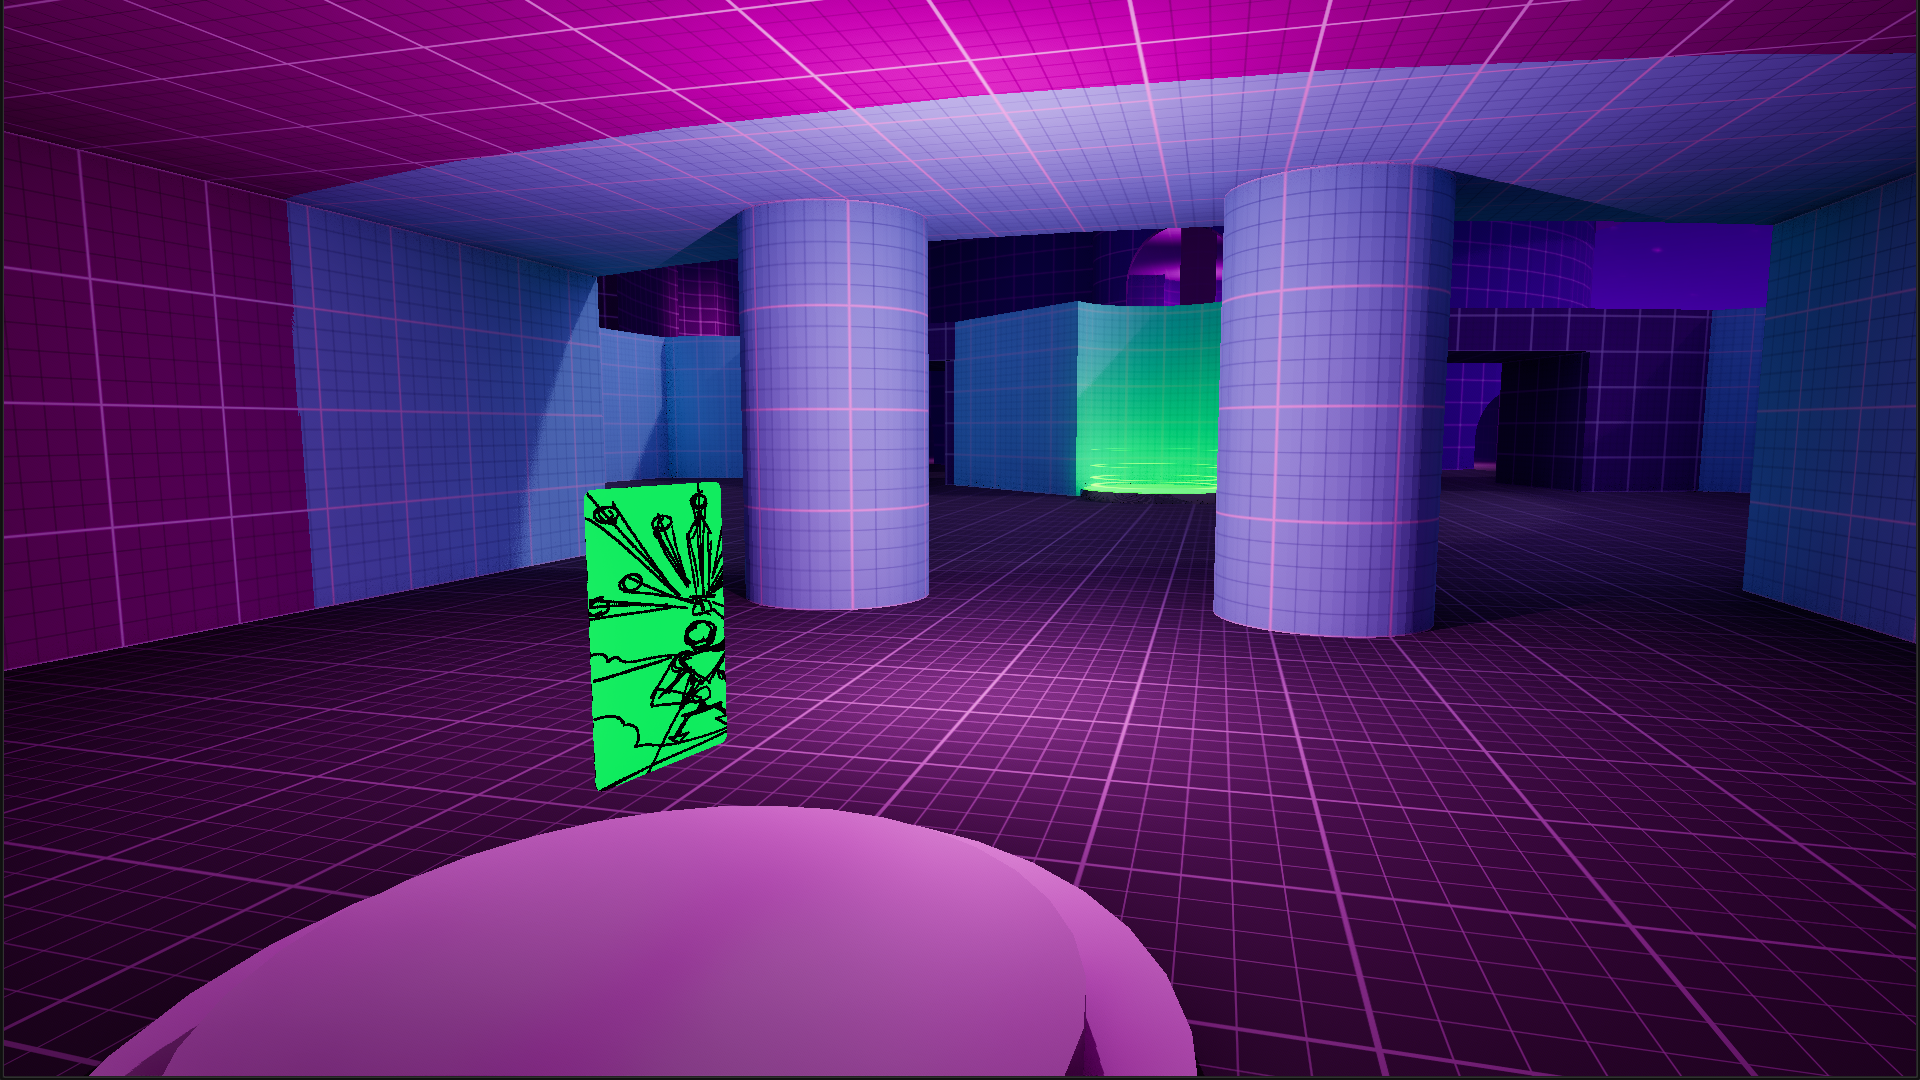
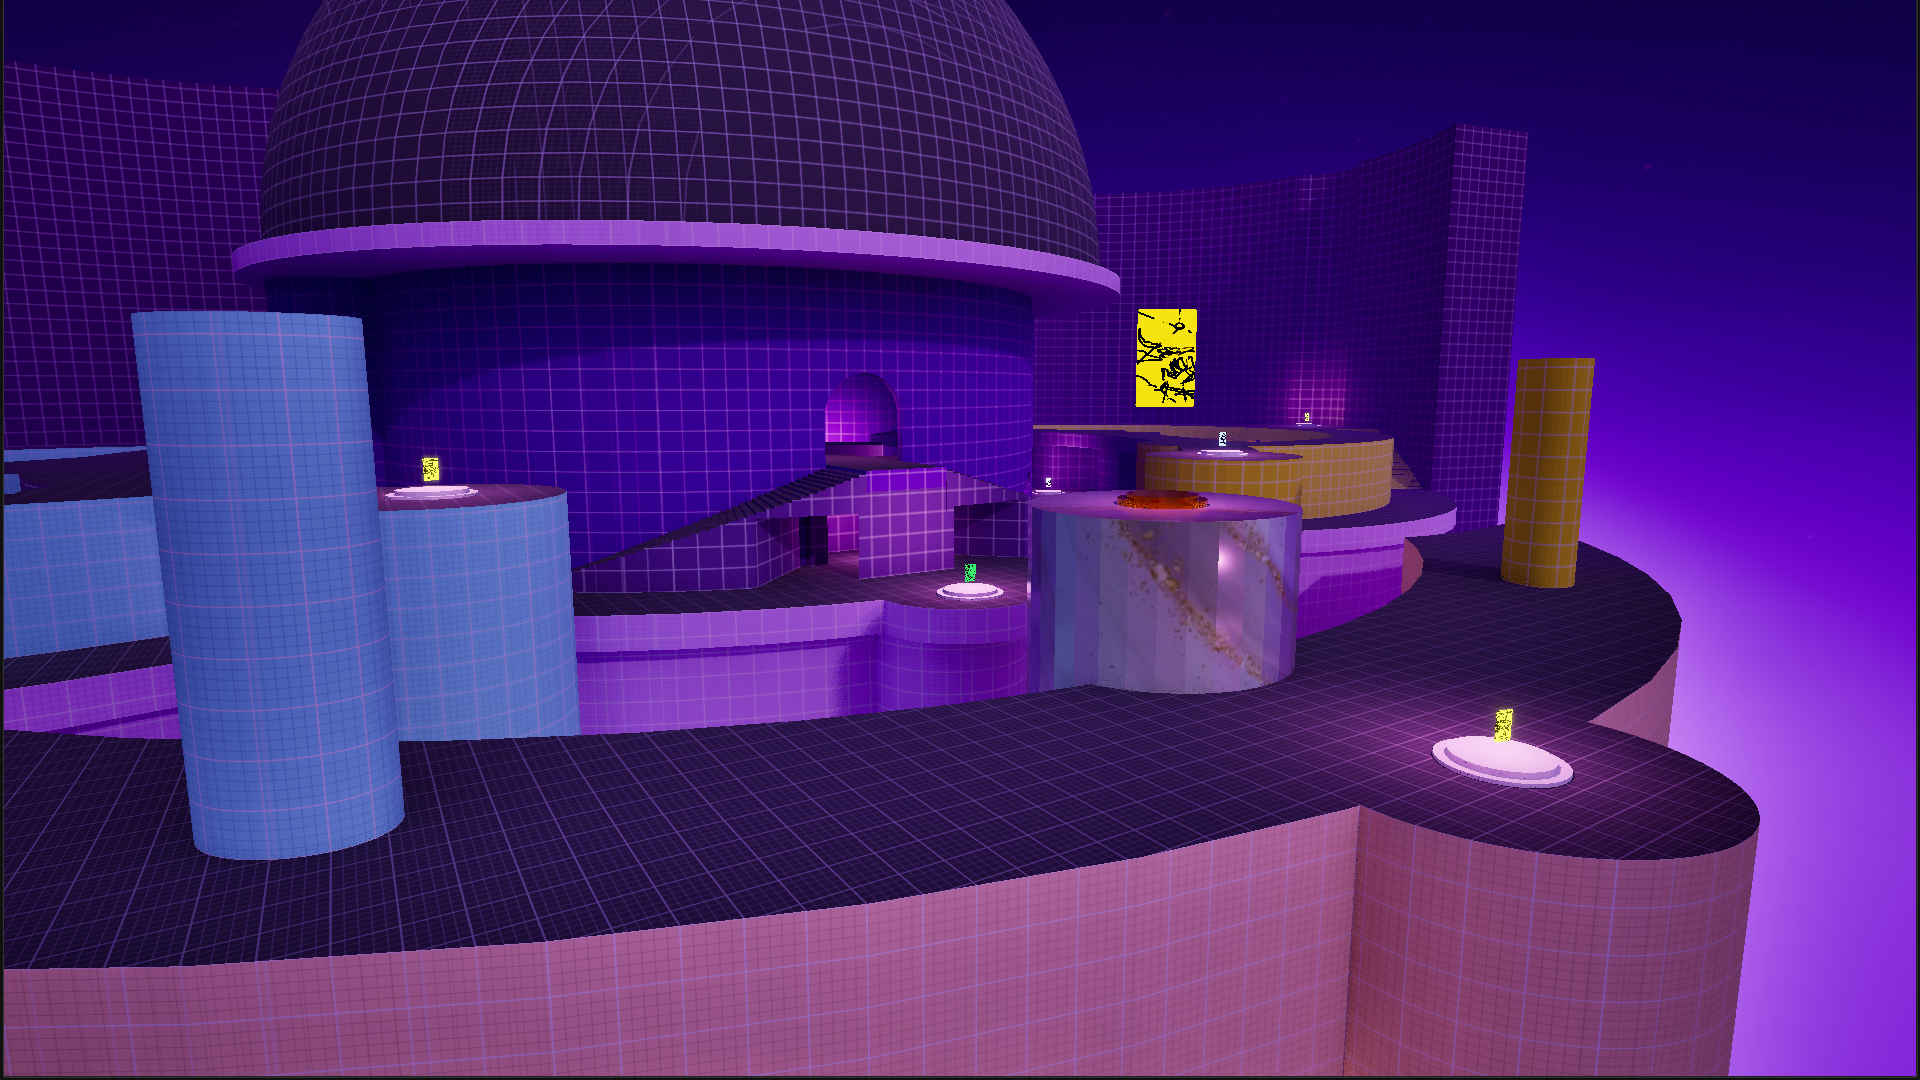
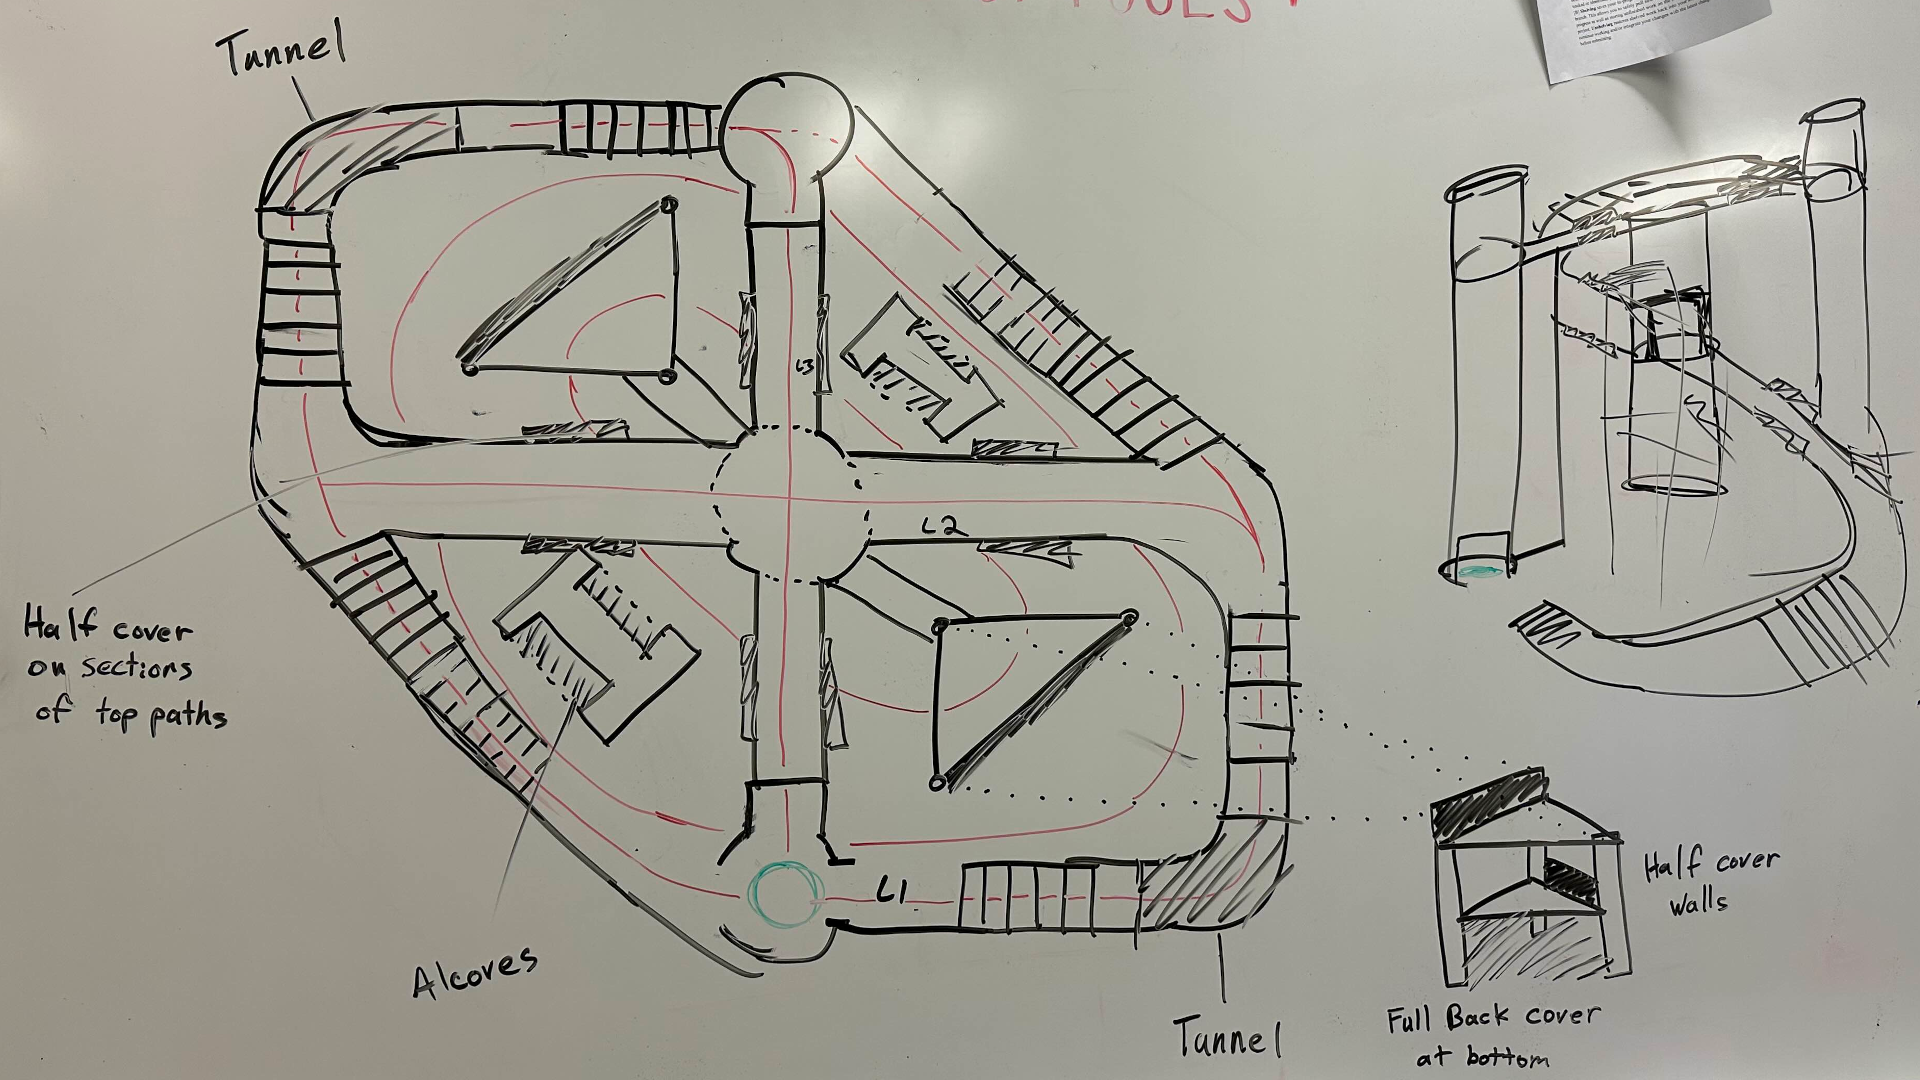
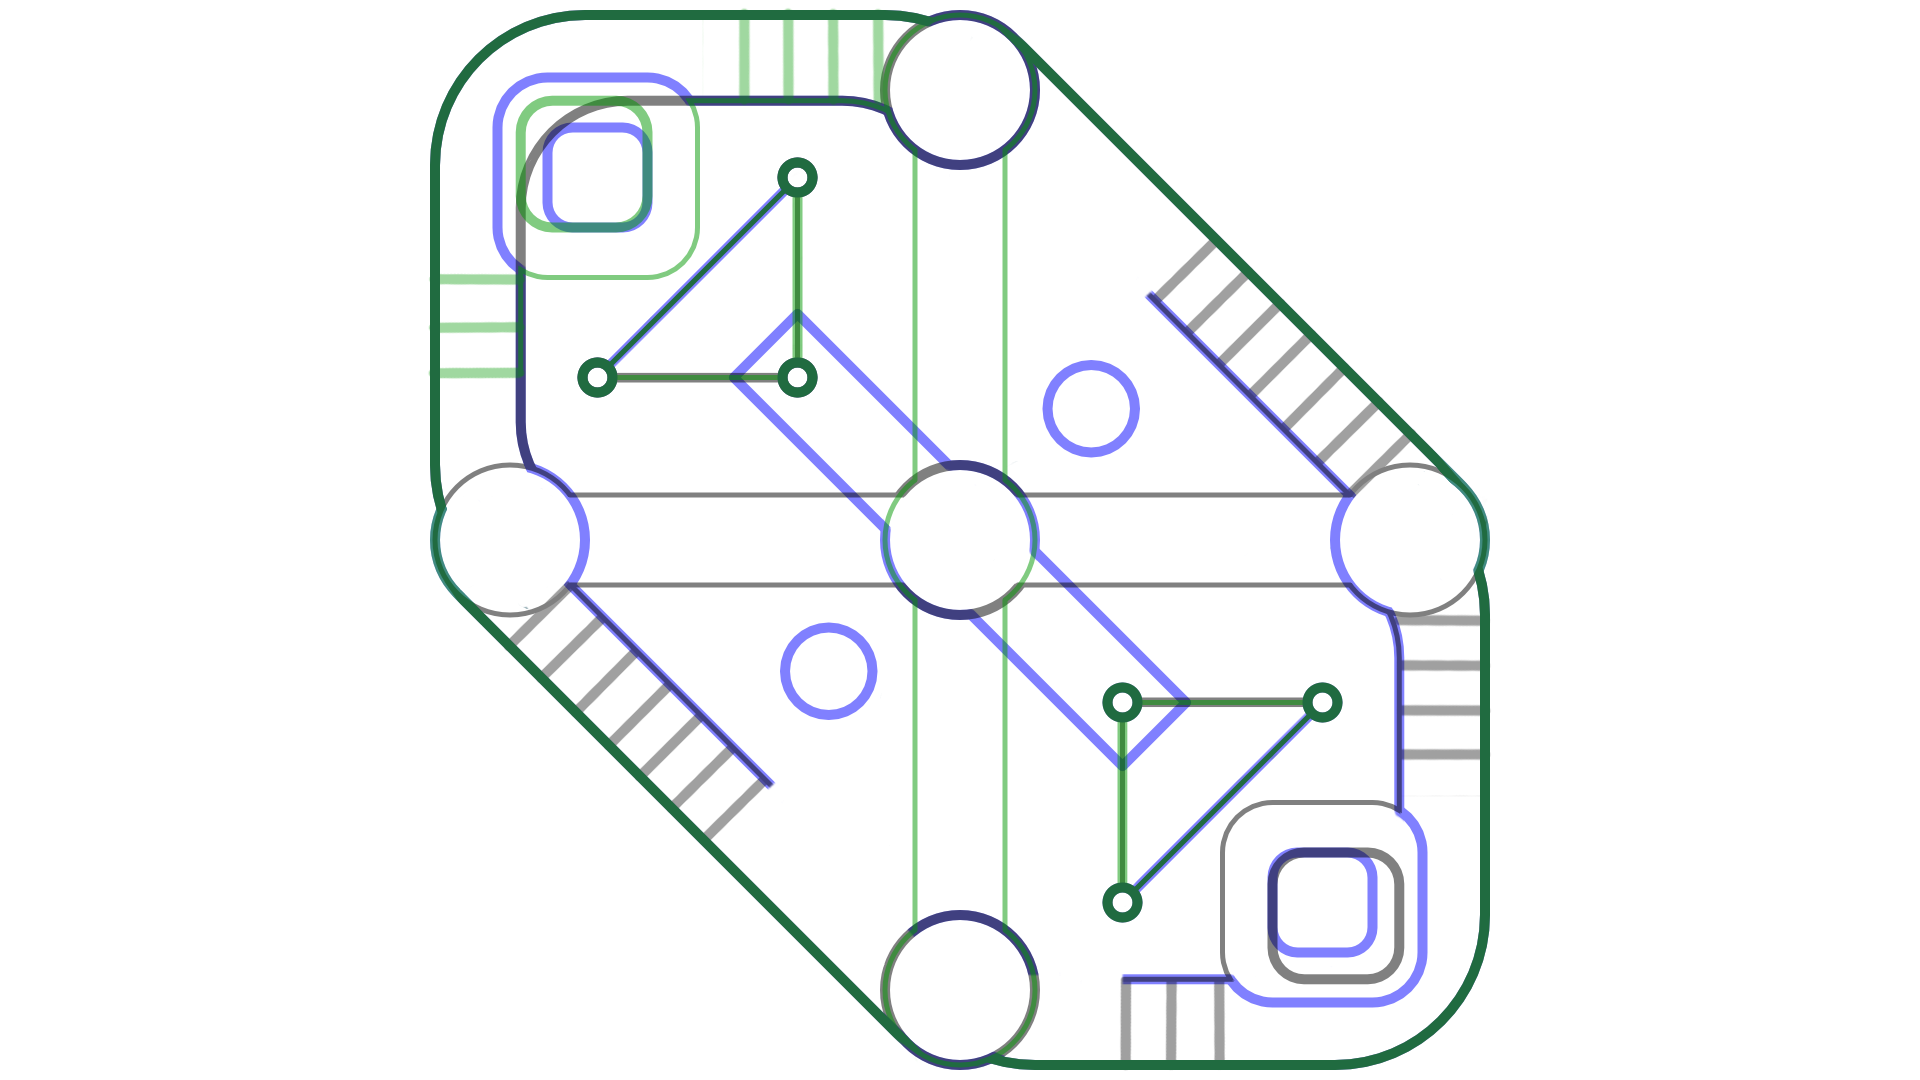
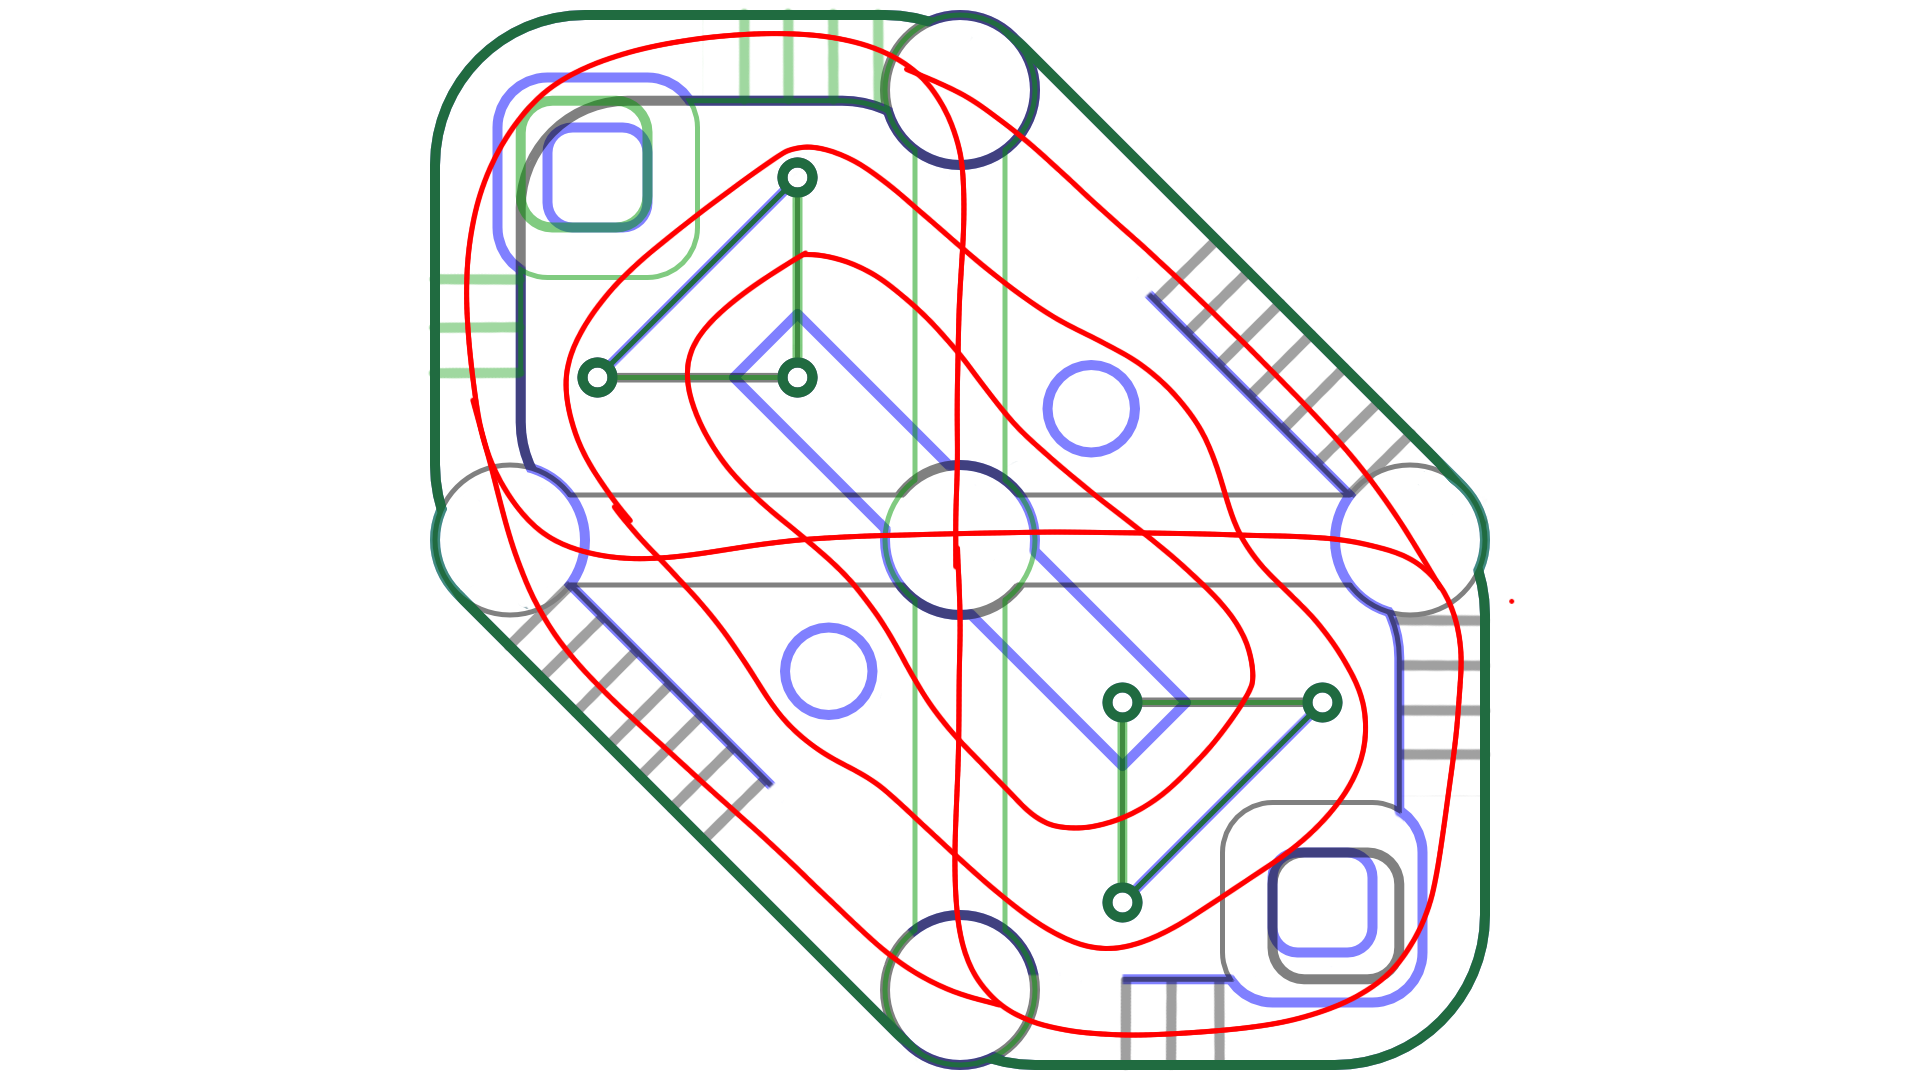
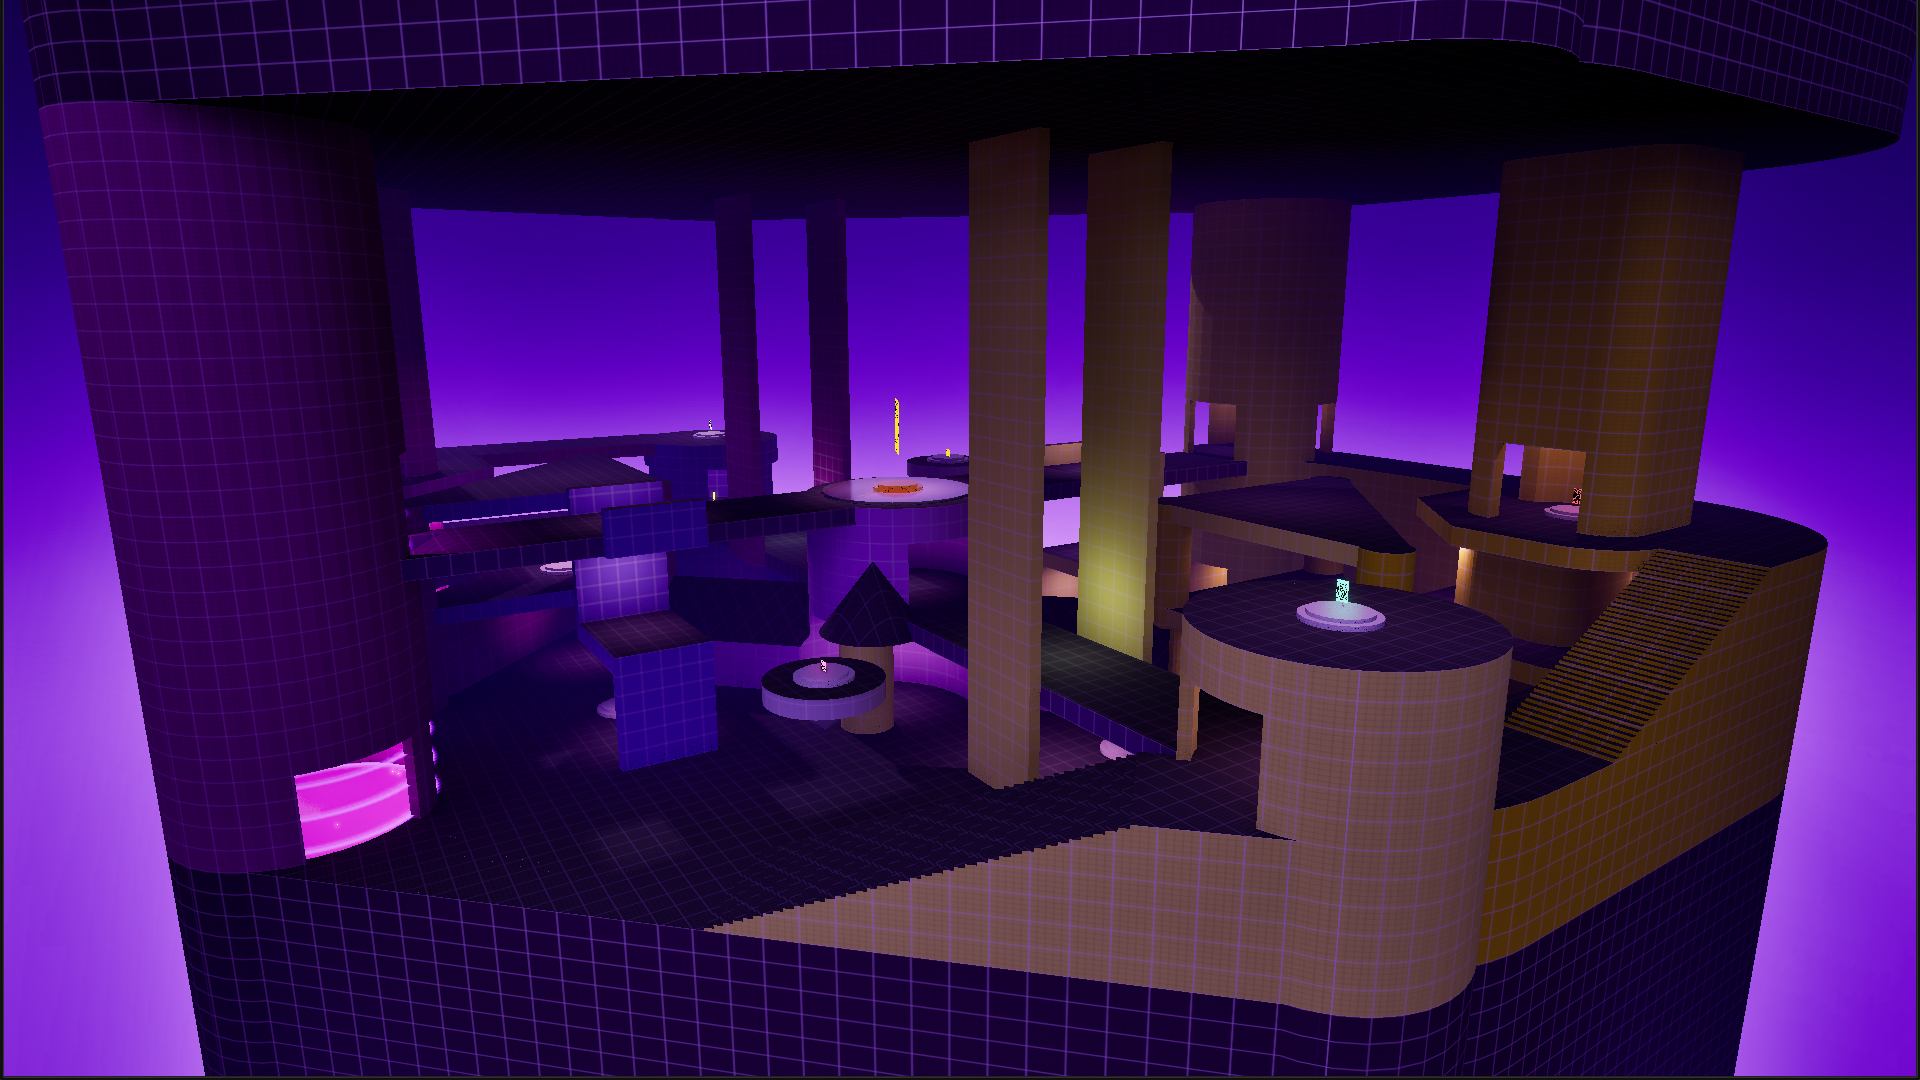
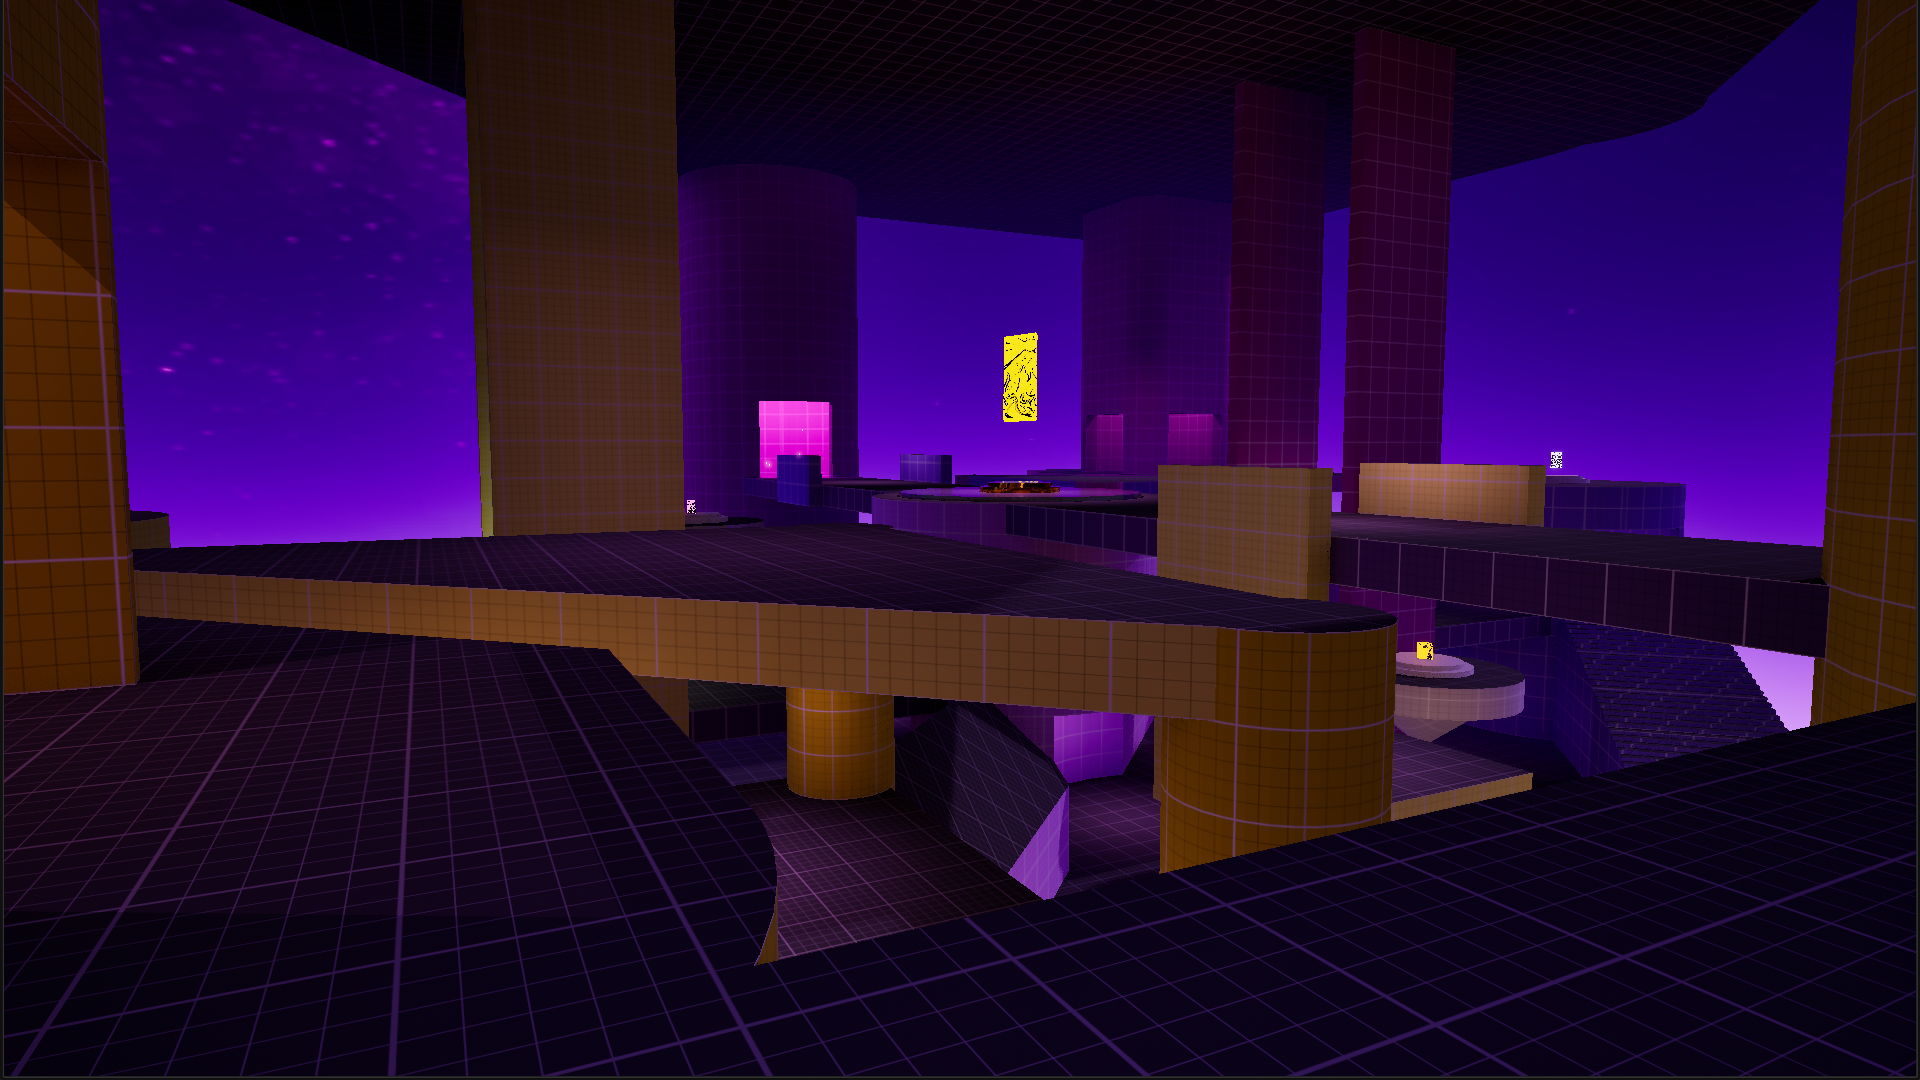
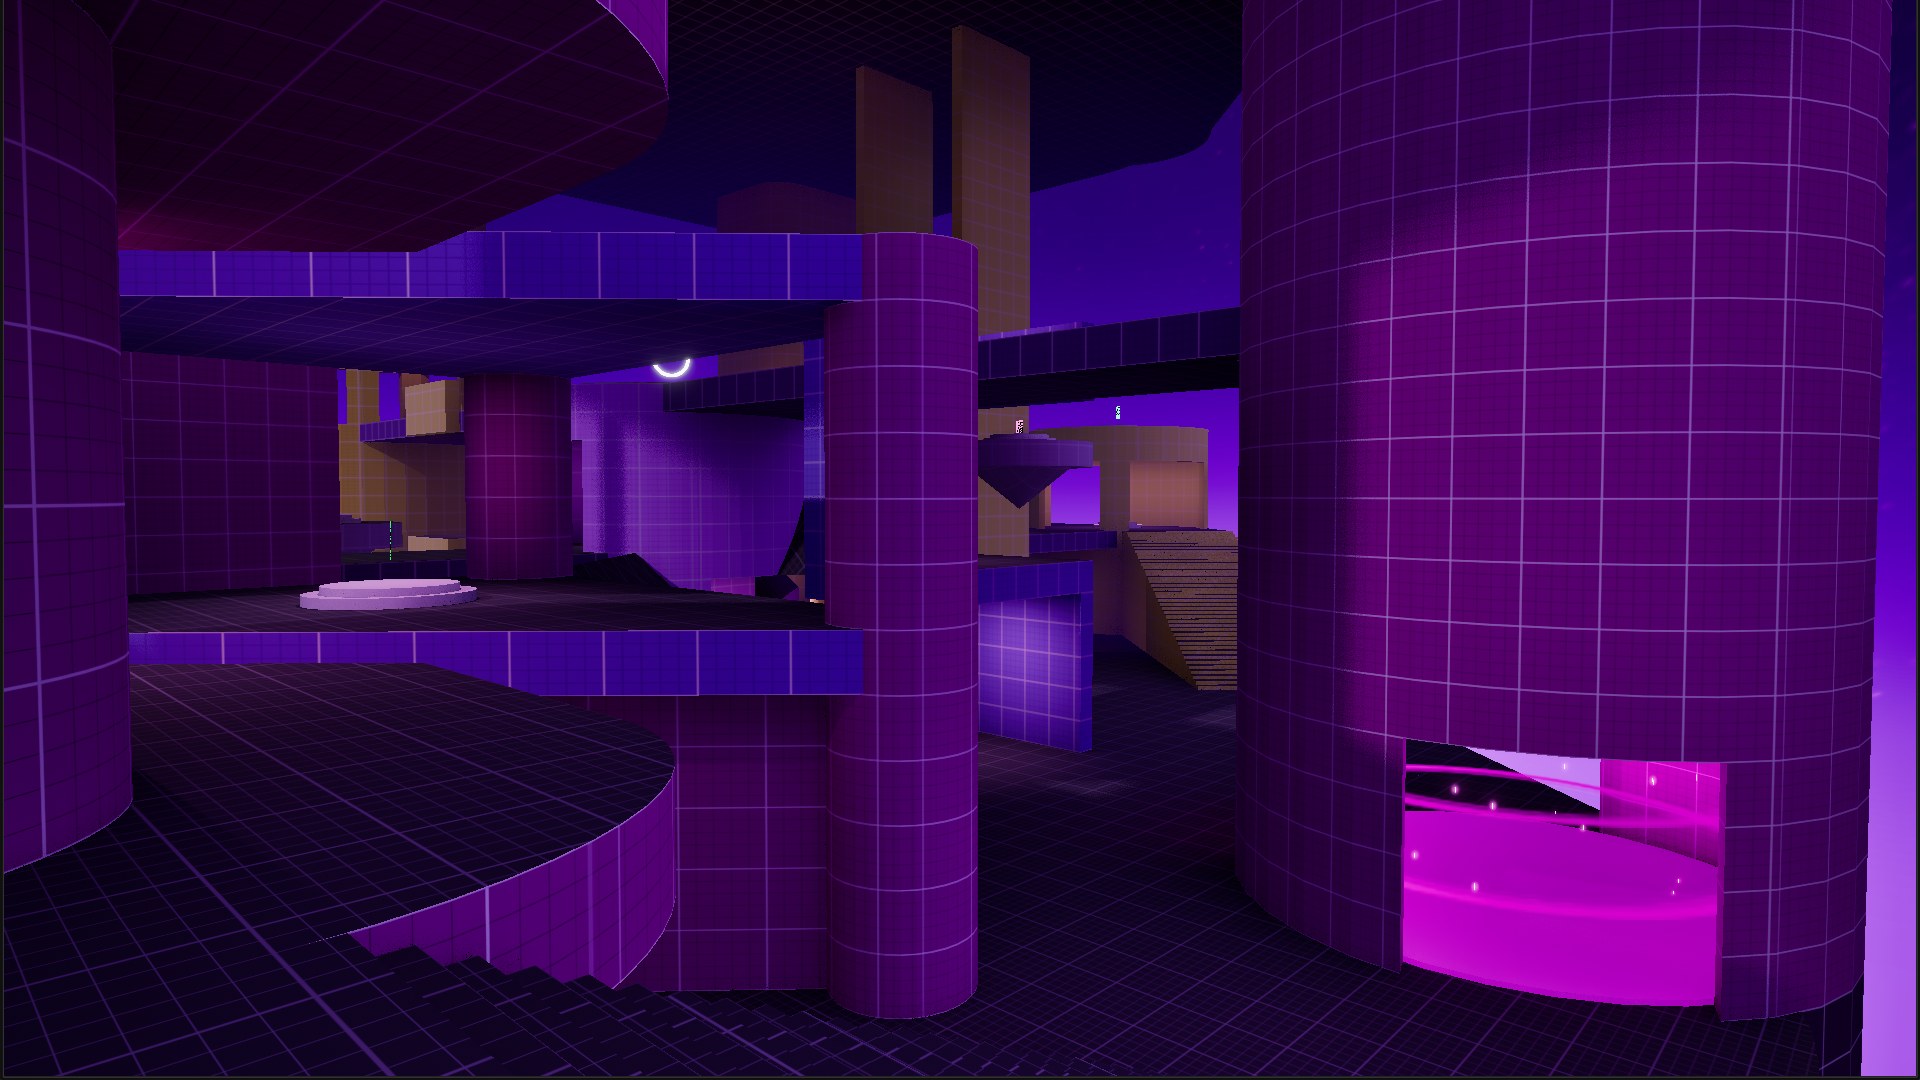
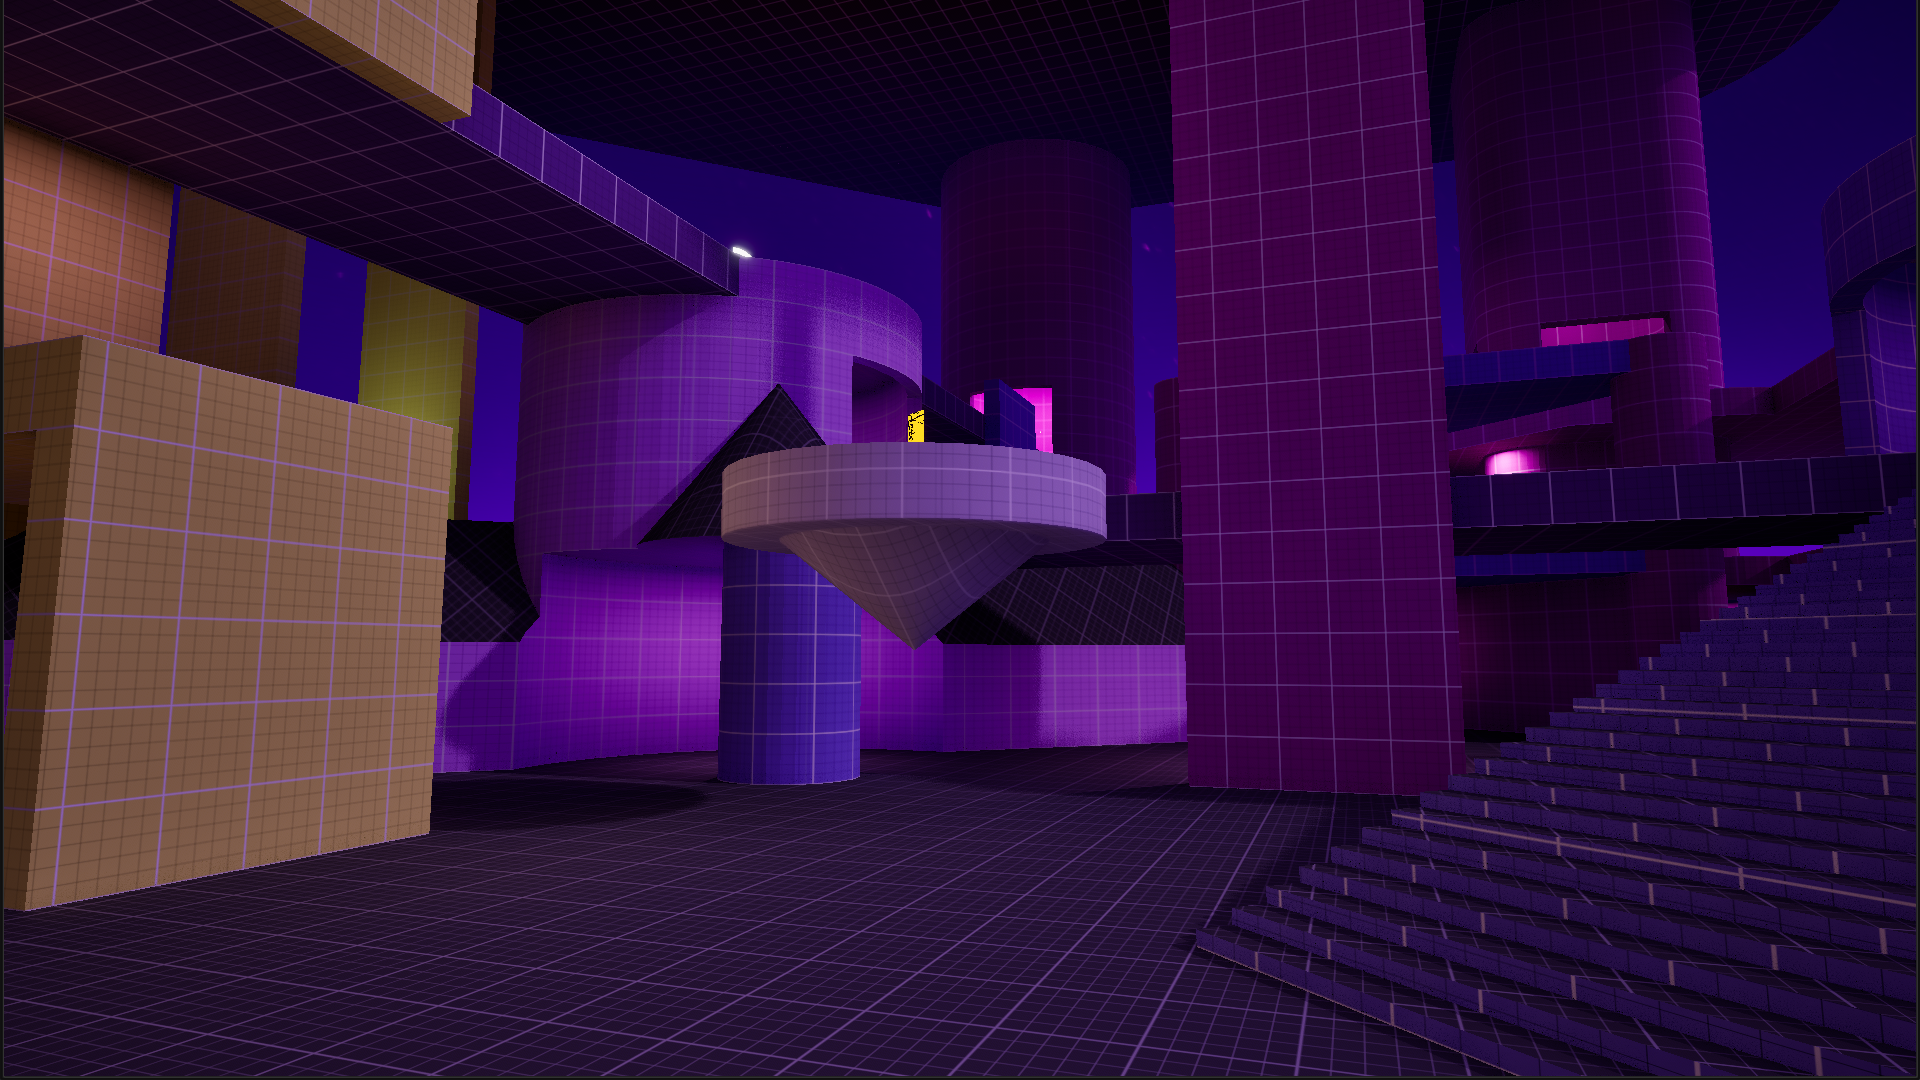
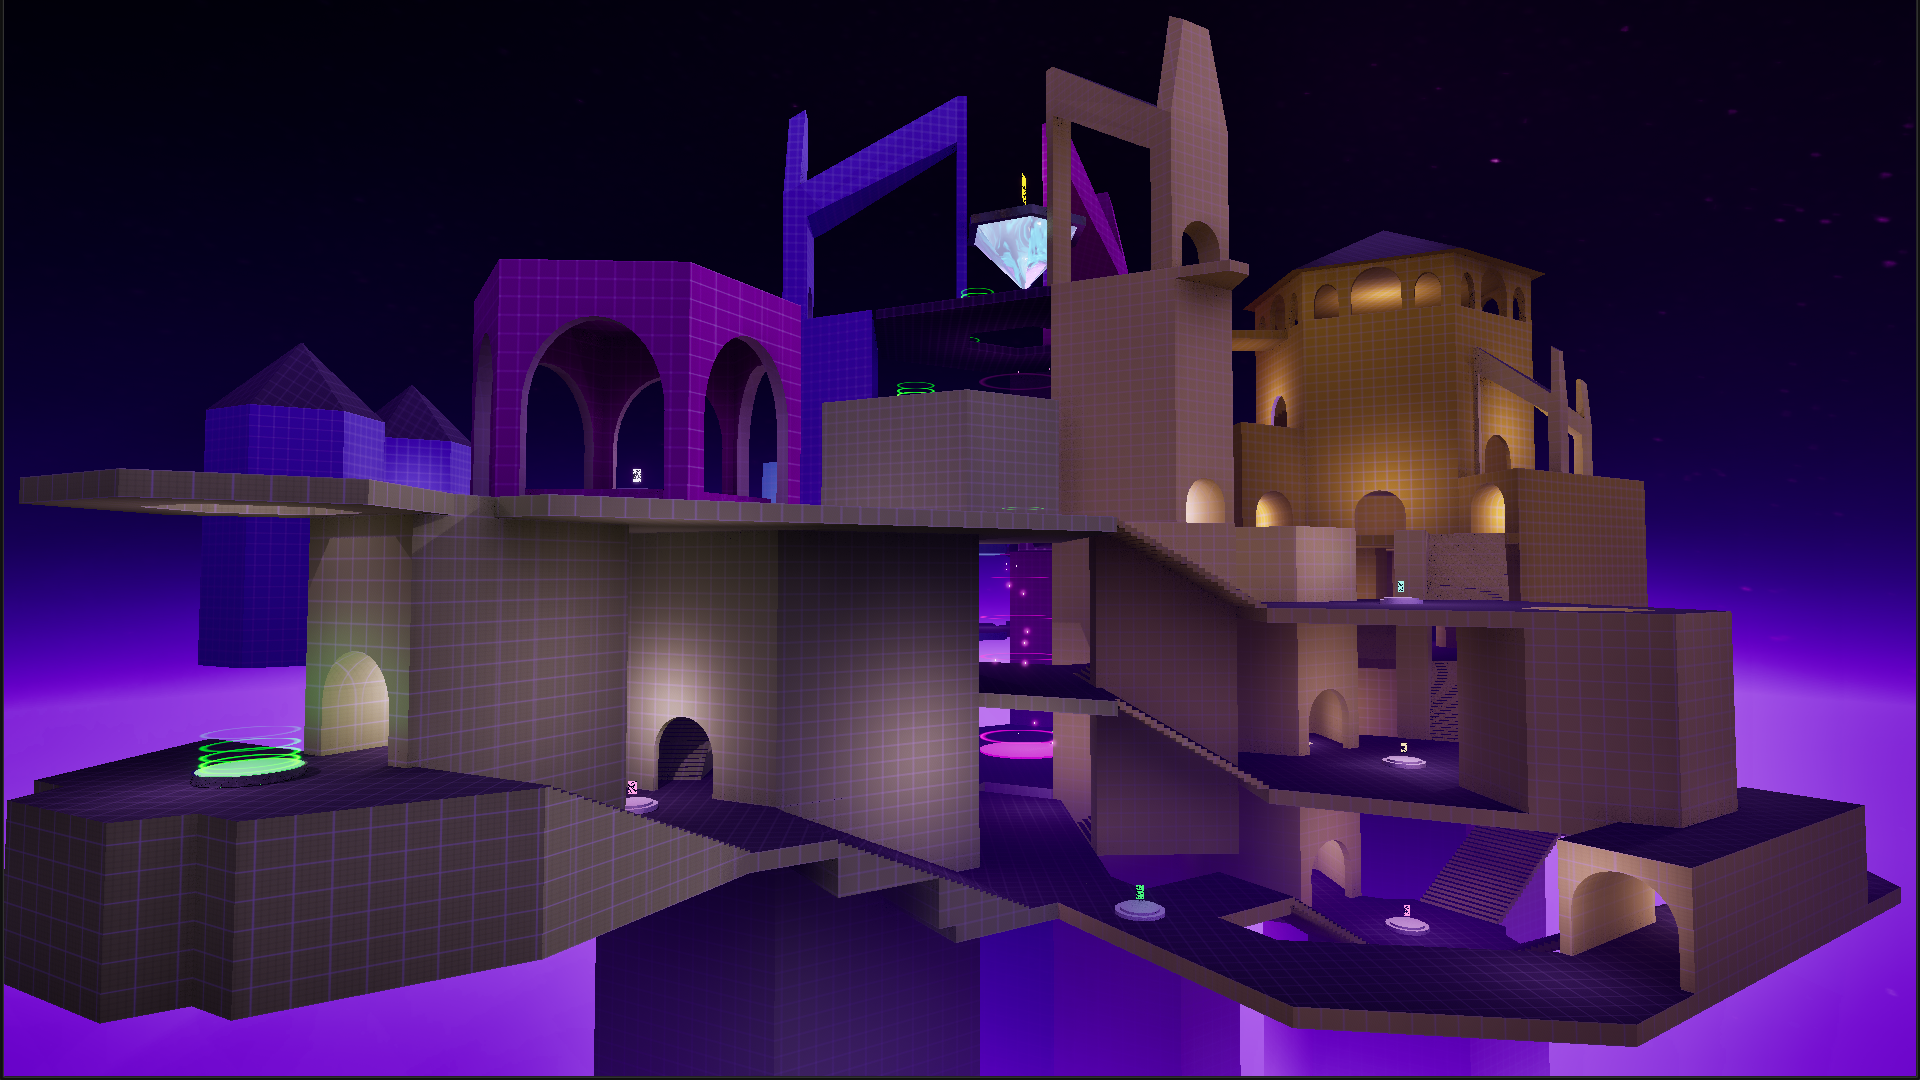
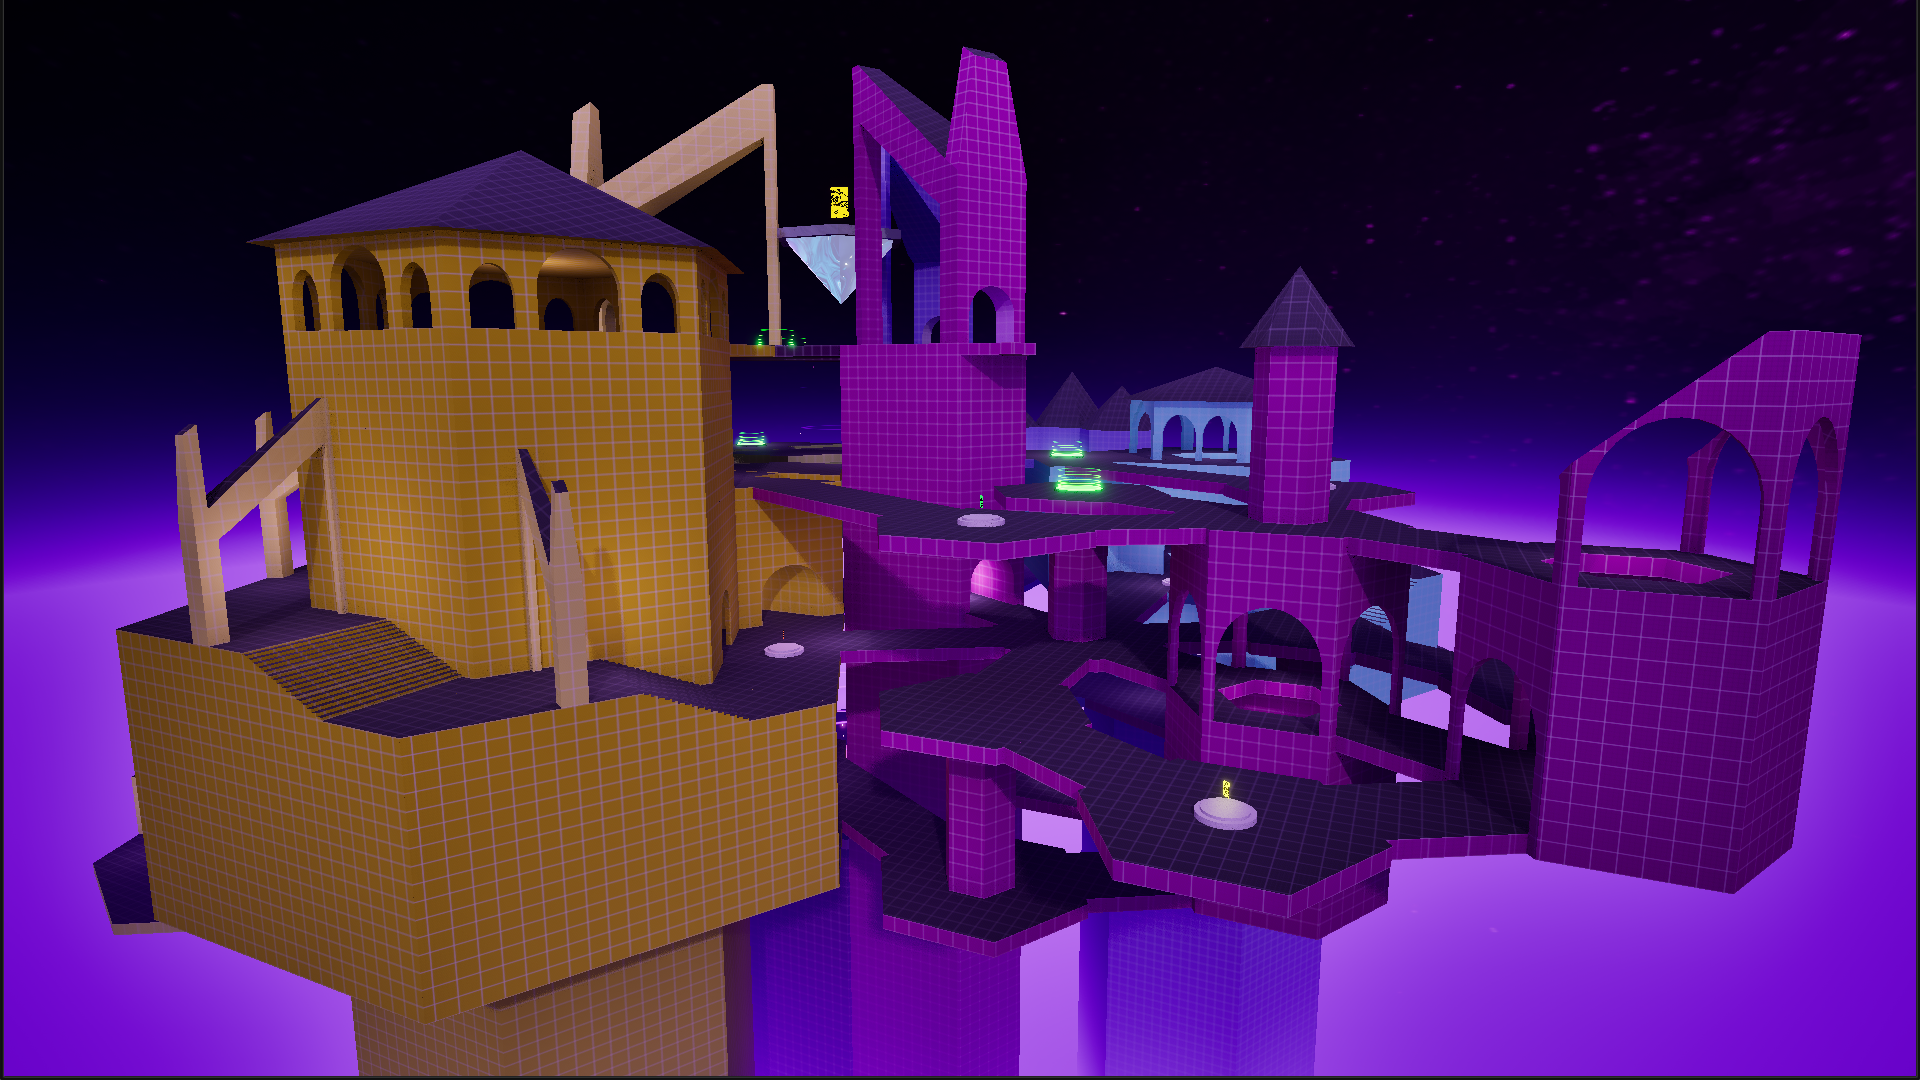
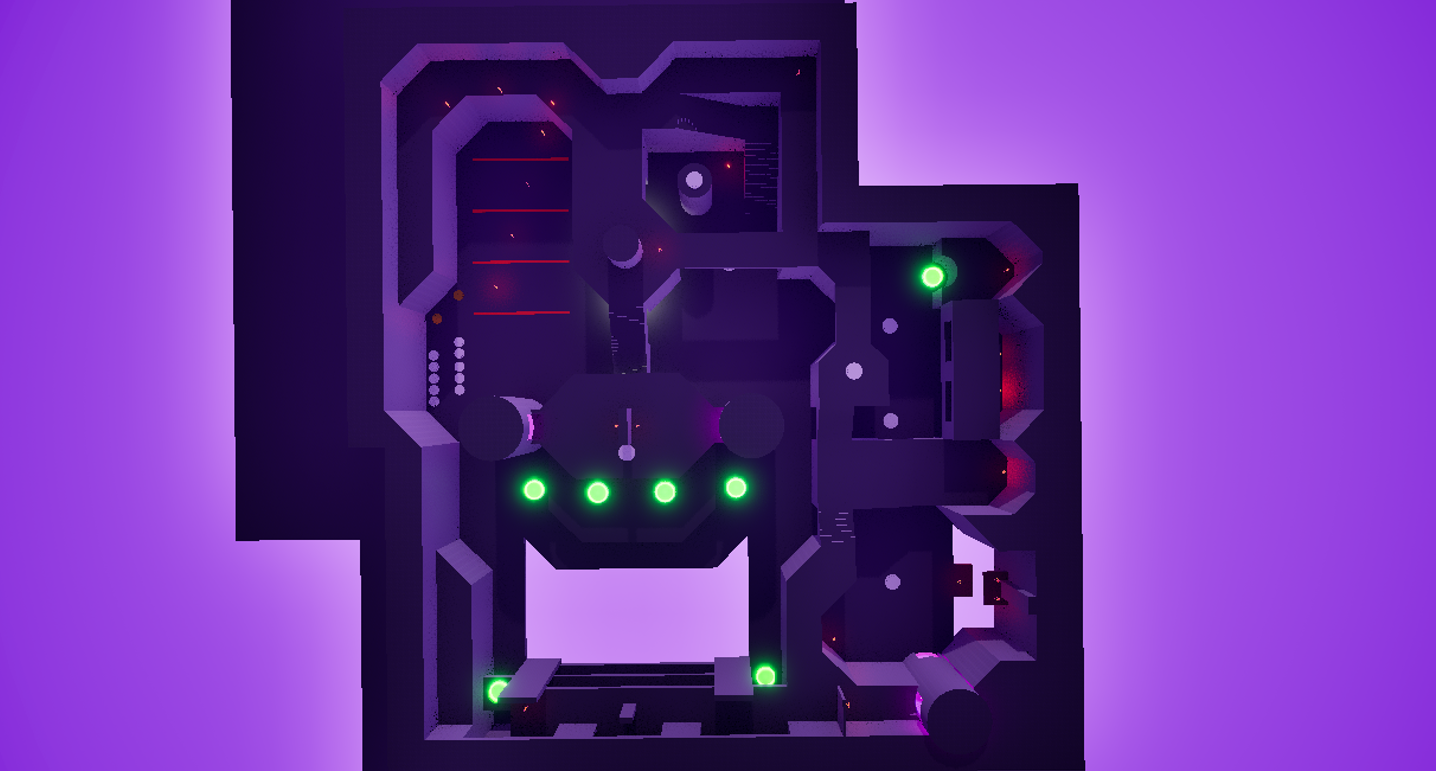
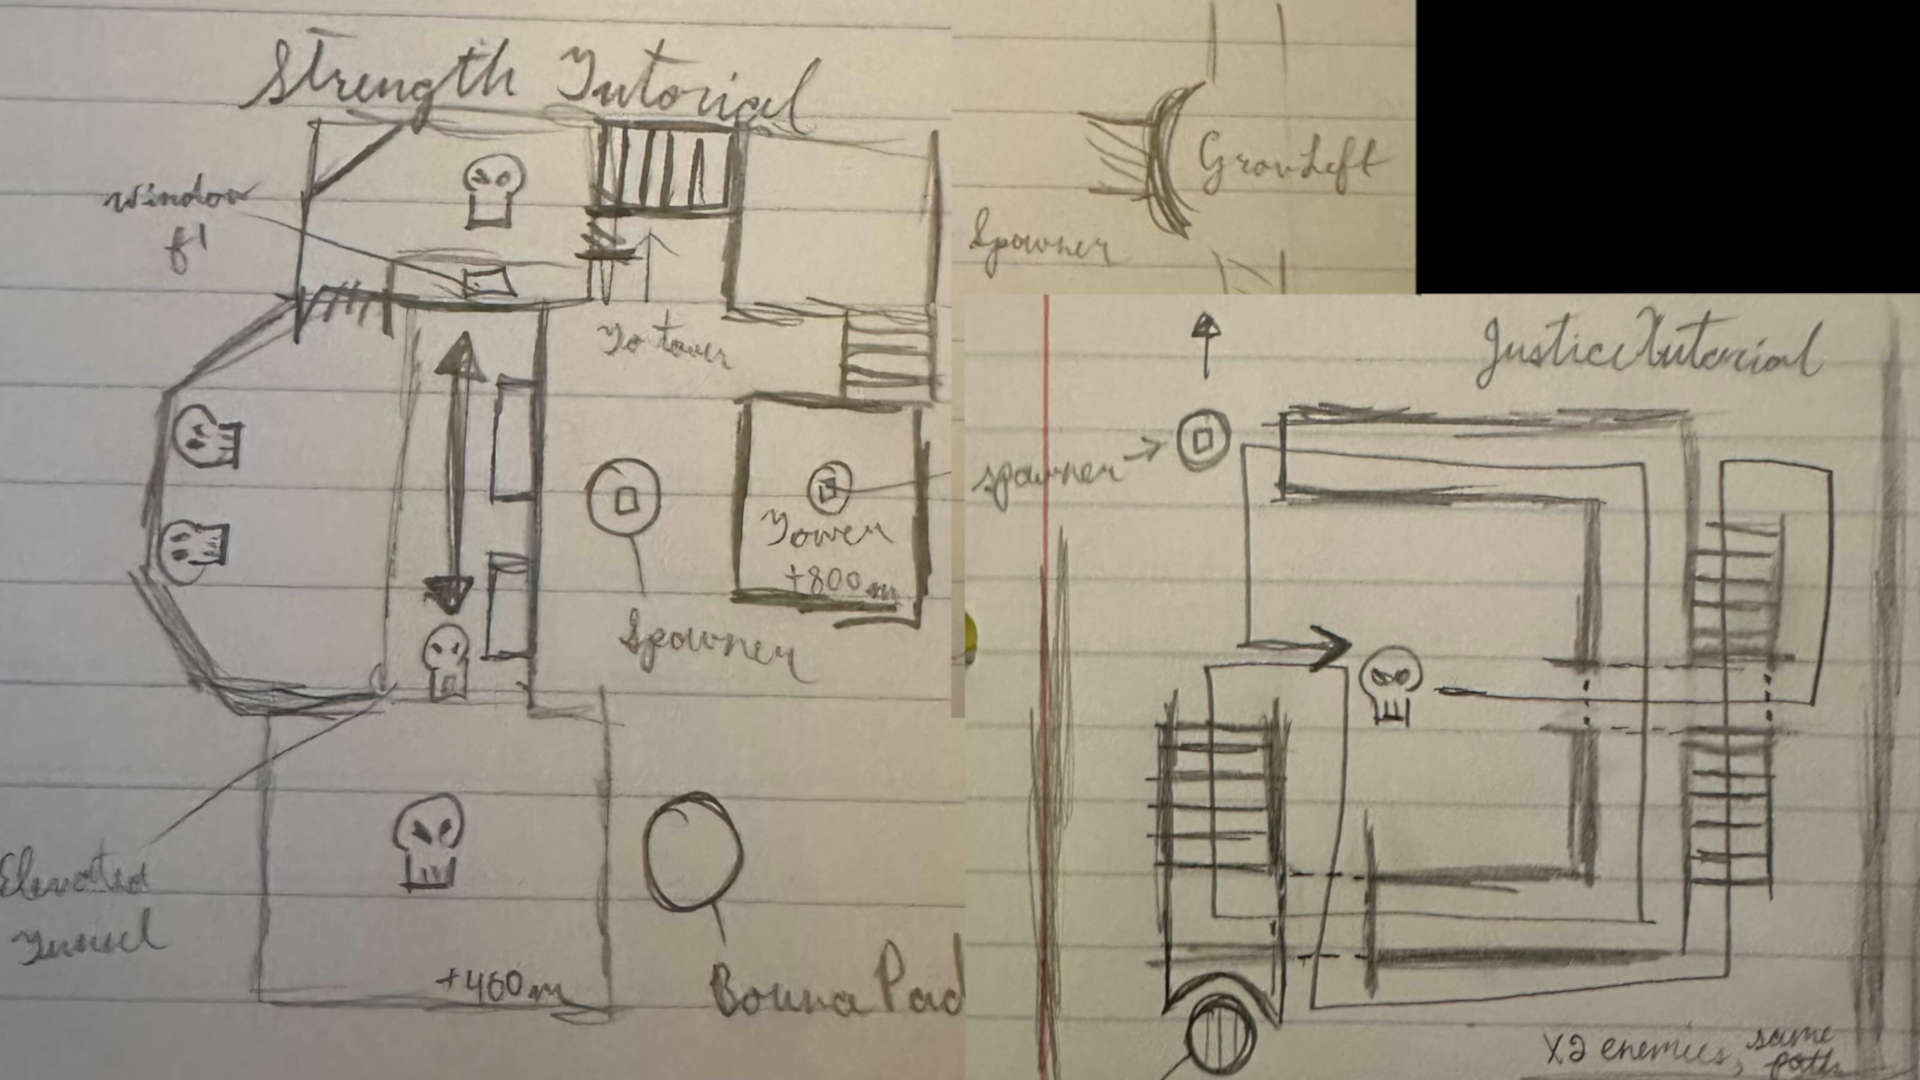
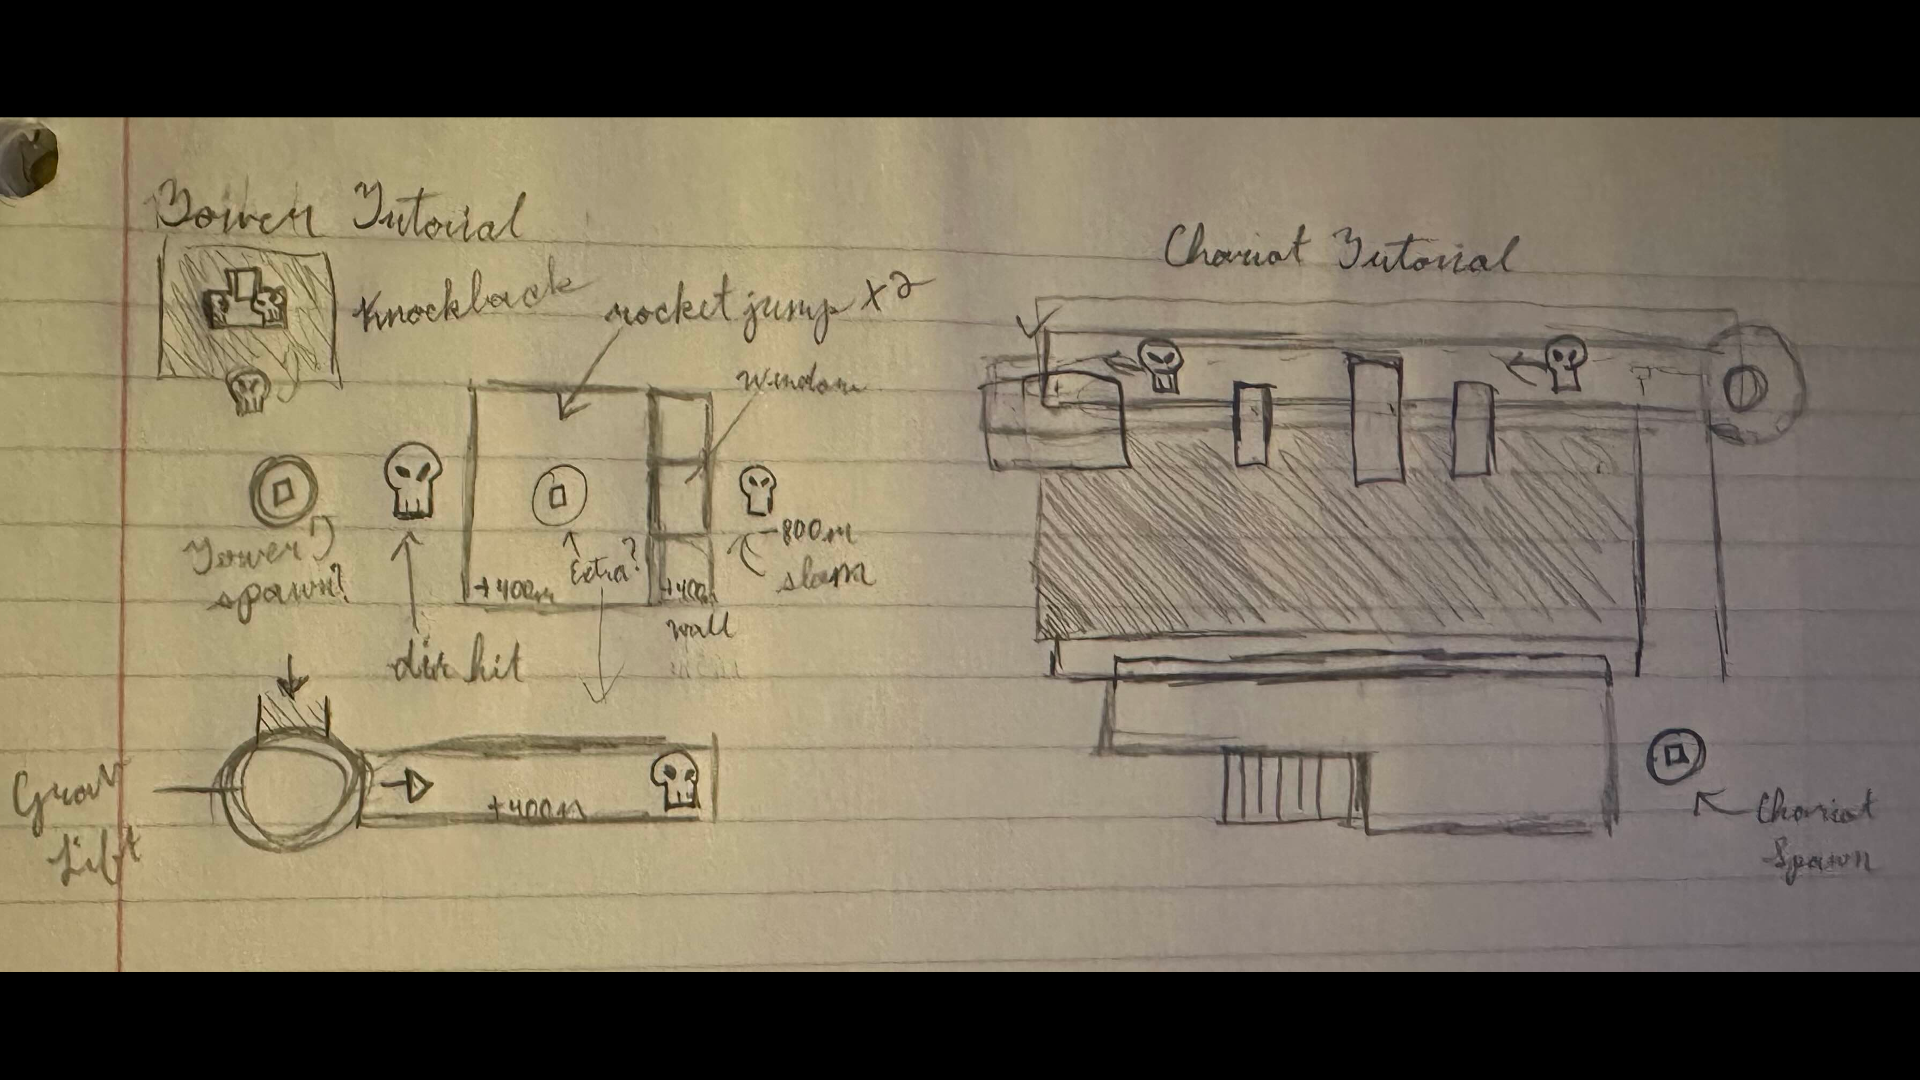
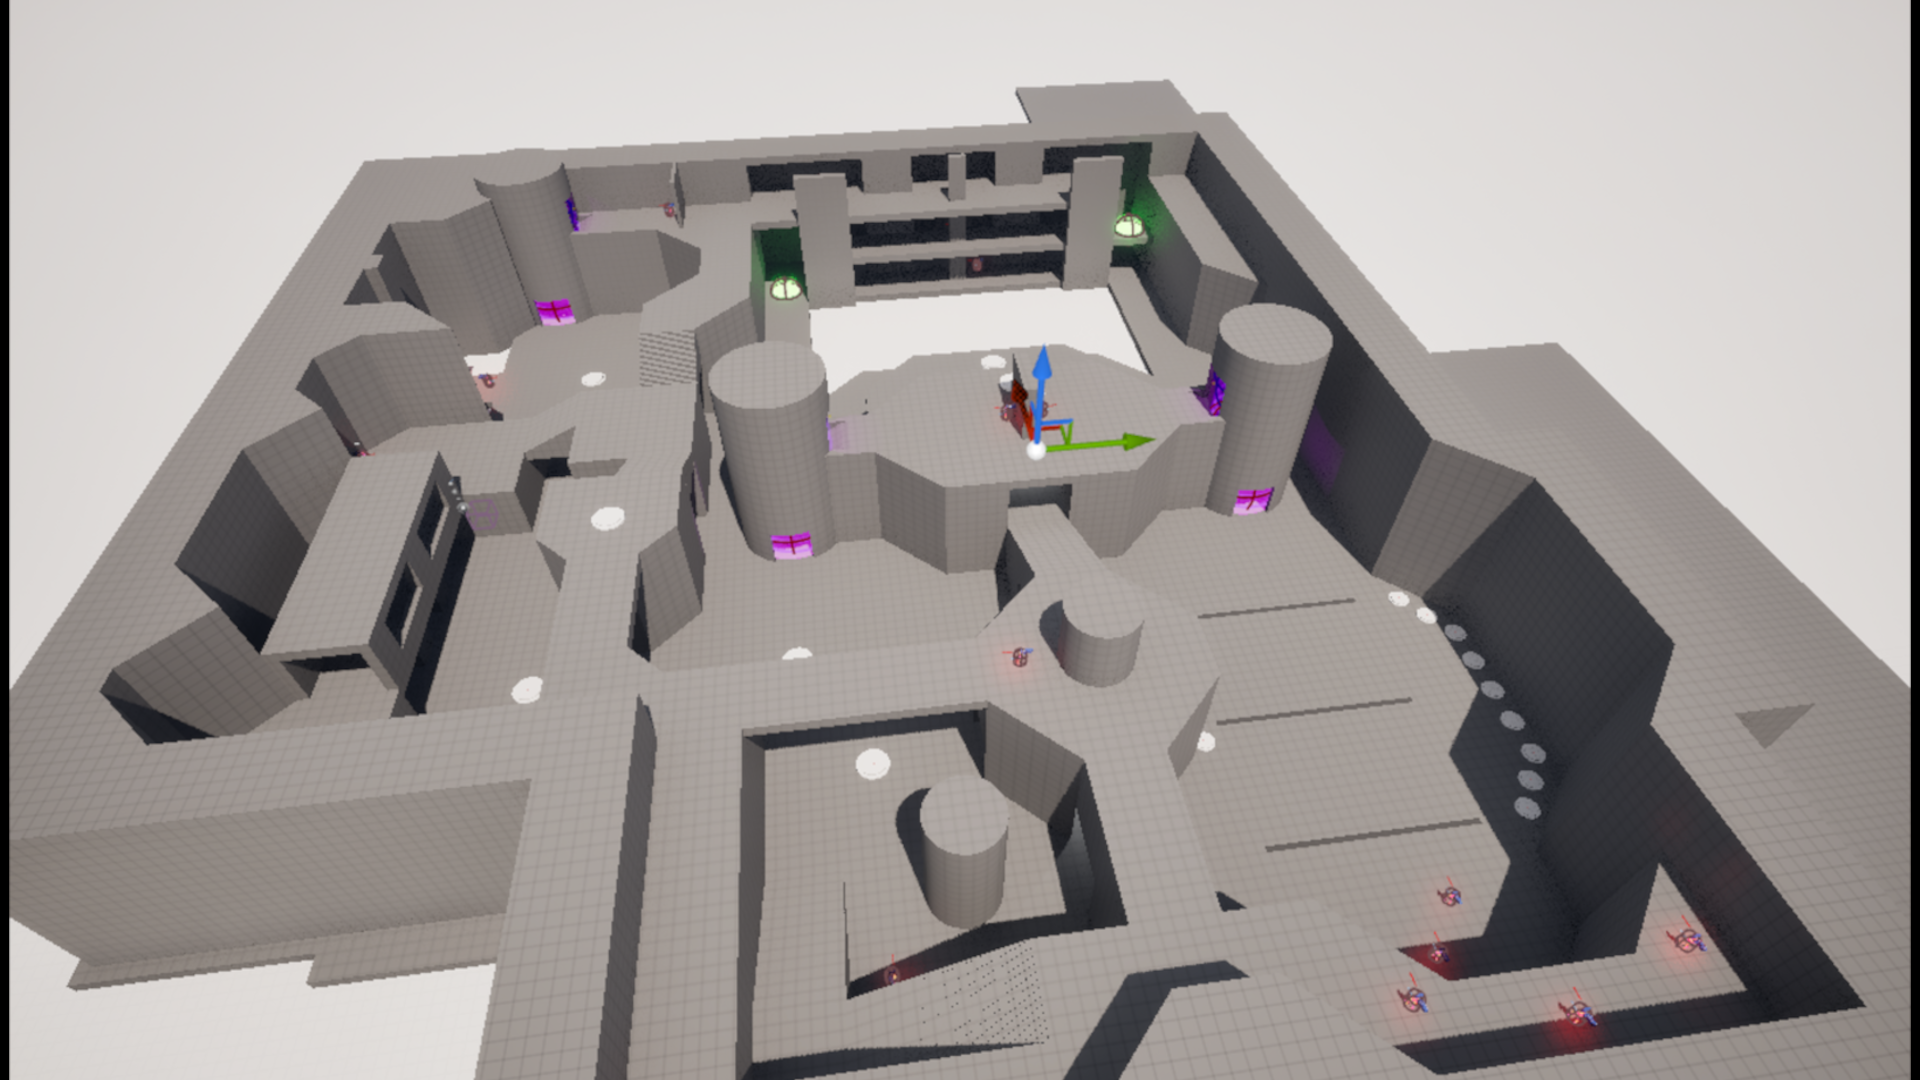
- Grayboxed and iterated on 3 multiplayer FFA arena maps and a practice range, integrating gameplay and level features based on level design pillars to encourage strategic player movement.
- Structured level geometry to promote skill expression through gunplay and movement mechanics.
- Adhered to the game pillar, "It's Fast to Flow," by designing lanes and loops for fluid and dynamic movement abilities.
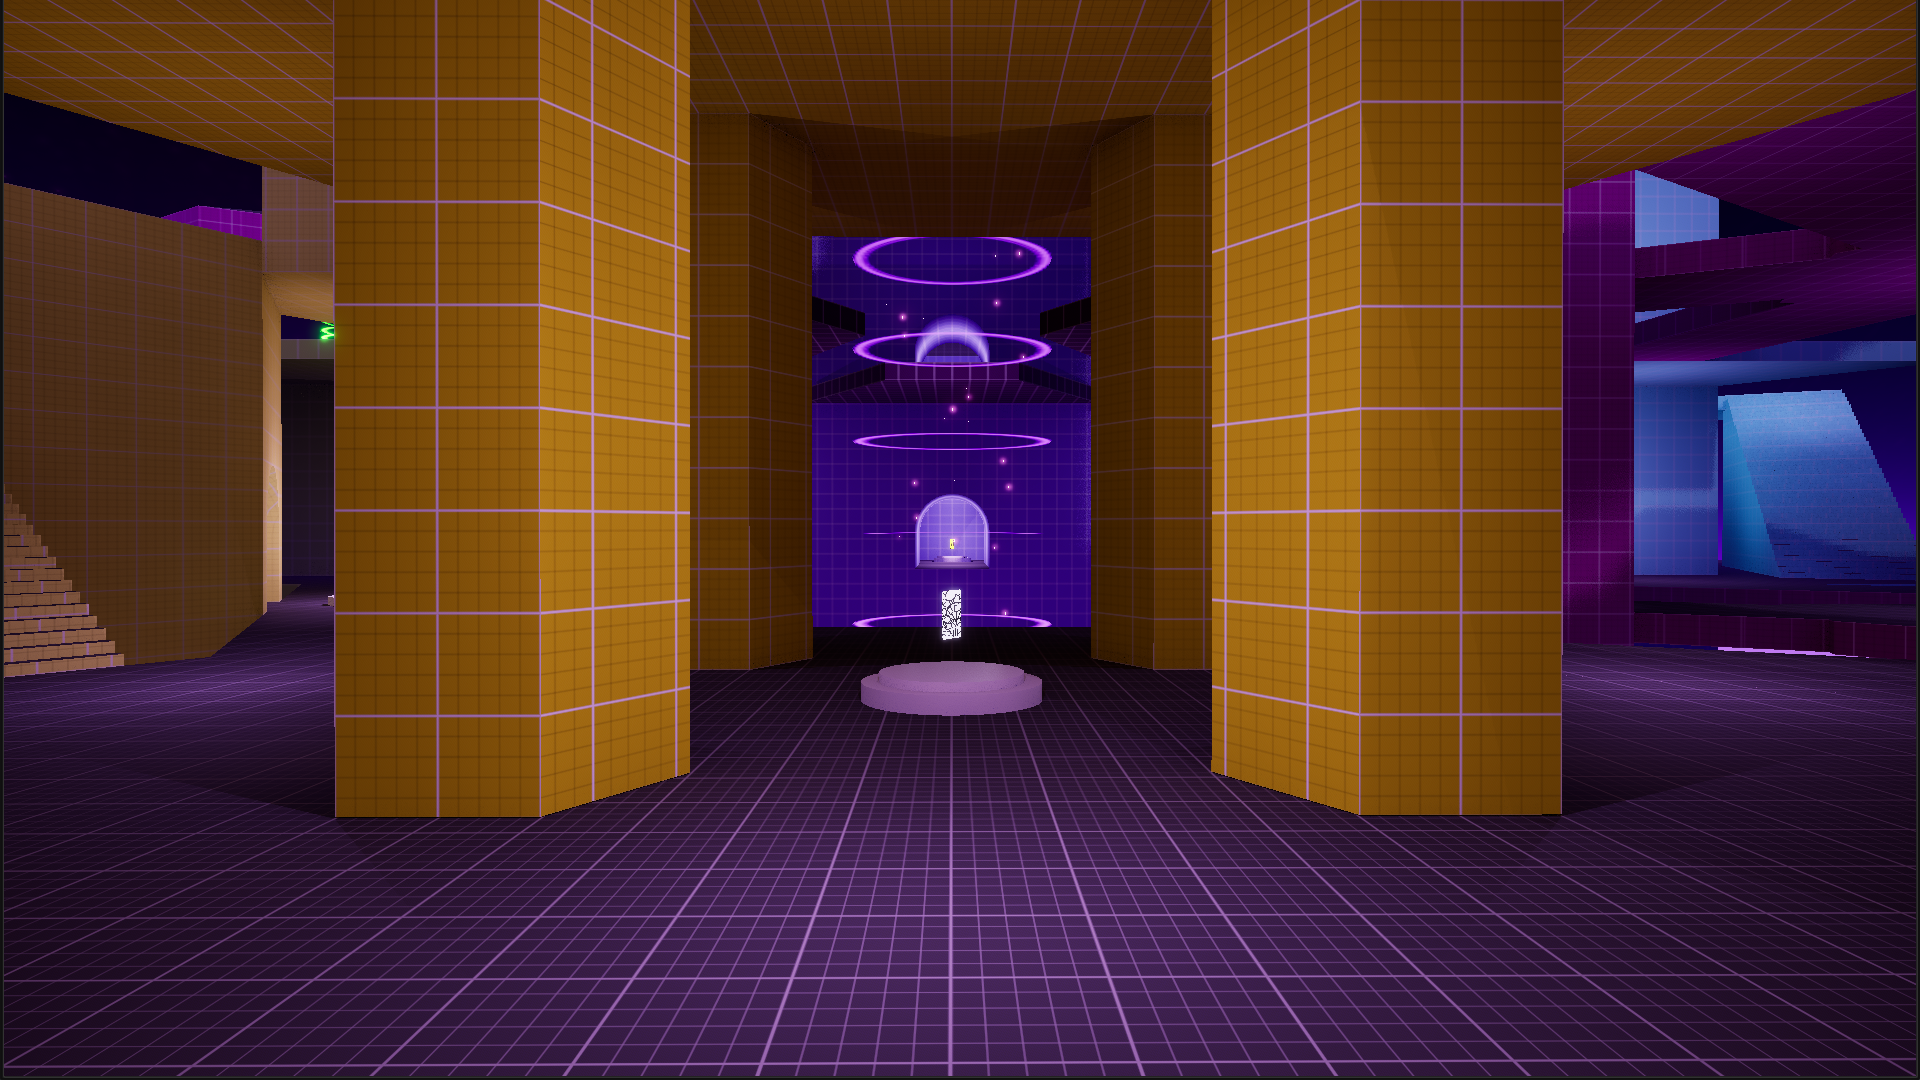
- Designed distinct areas using color schemes, lighting, and landmarks to guide players and enhance level flow.
- Developed networked arena mechanics:
- Player Spawning System
- Weapon Spawning System
- Bounce Pads
- Propulsion Lifts
- Moving Platforms
- Moon Power Weapon 1v1 Arena
- Utilized Unreal's GAS (Gameplay Ability System) to bring power weapons and abilities to life.
- Coordinated playtests of LAN and Steam network systems, including a 40+ person public stress test to validate technical performance.
Implementation in Review - Tools
Refining Levels and Optimizing Client FPS through Telemetry Visualization Tools
Purpose of Telemetry Collection and Visualization
In fast-paced arena shooters, level readability, engagement flow, and performance stability are critical to ensuring a smooth player experience. To better understand how players and bots were engaging with levels, I developed a telemetry visualization tool that collects and displays in-game data directly within Unreal Engine 5.4. This allowed me to analyze movement patterns and lane utilization, high kill zones and possible power positions, and client FPS performance after playtests were conducted. Using this tool, I identified map traversal inefficiencies for both players and bots, spawn imbalances, and performance bottlenecks, leading to key optimizations across multiple levels.
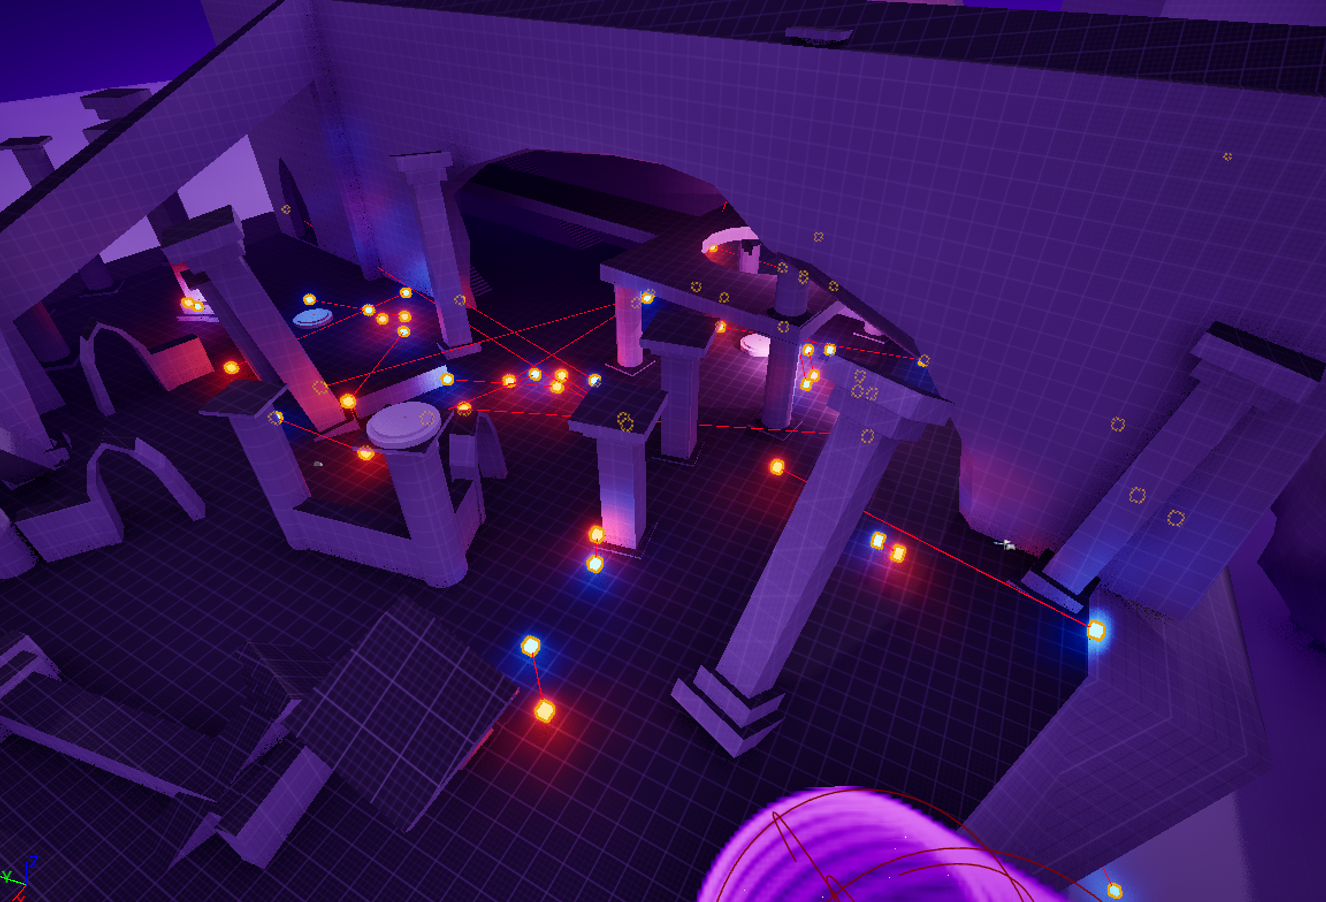
Displaying Kill & Death Data
After collecting telemetry from matches, I wrote a script to parse the CSV data and visualize it by spawning colored cubes for killer and victim positions, drawing lines between them to indicate relativity. This provided level designers with a clear view of player interactions in 3D space, something a heatmap alone couldn’t convey.
Displaying Positional Data - Players
I set up the positional tracker to record key data like positions, facing, timestamps, current life, client FPS, and player names. This allows level designers to filter and analyze player movement across lanes and spaces at different points in the match. These insights help identify underused or congested areas, enabling designers to adjust the level layout for better flow and optimize player engagement.
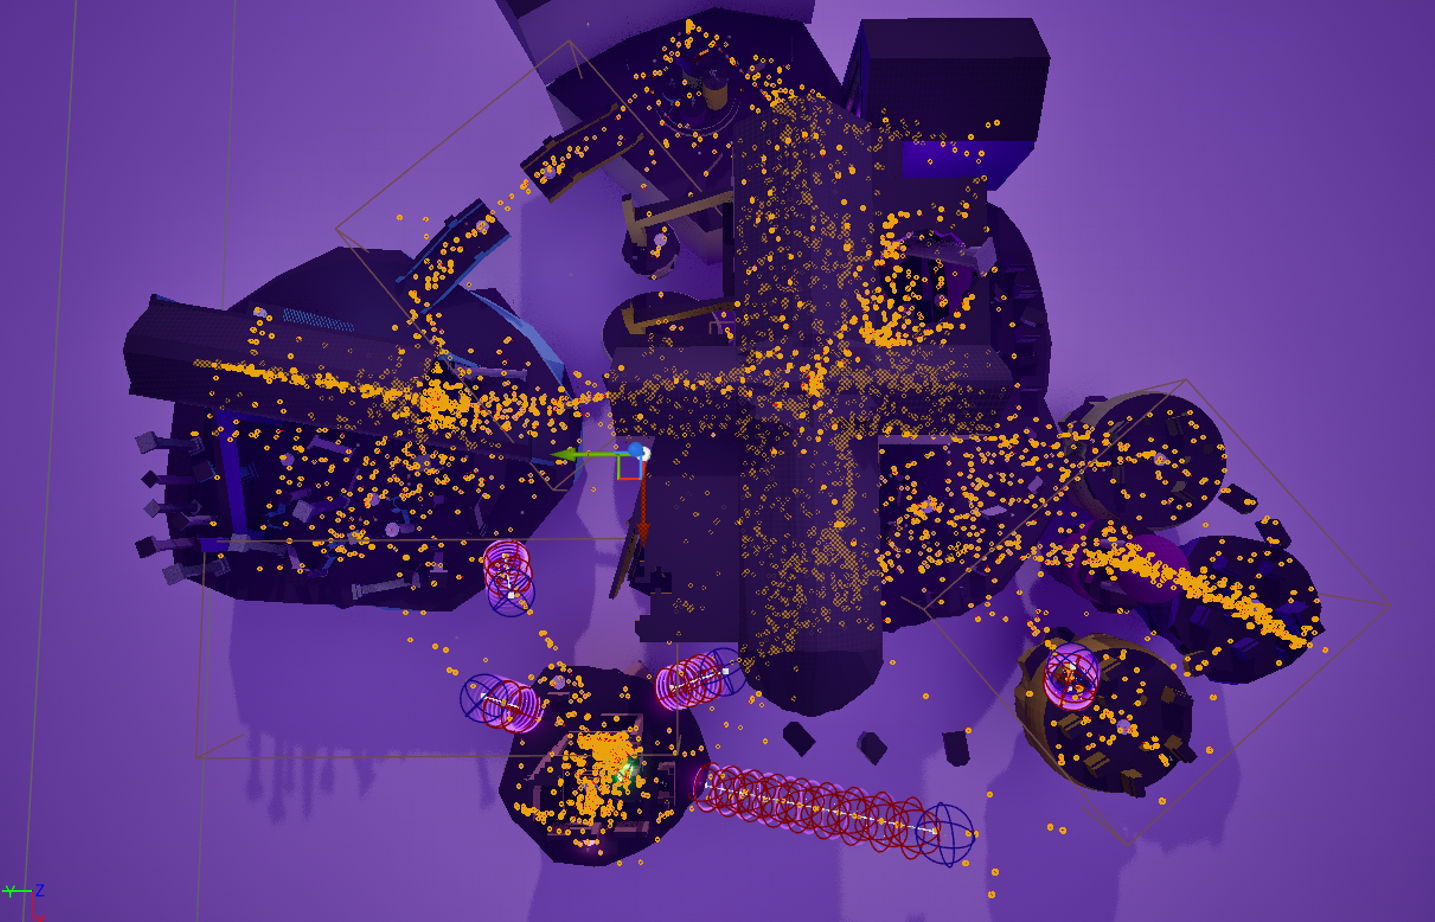
Displaying Positional Data - Bots
In addition to helping level designers optimize levels for players, the positional telemetry also revealed areas that needed improvement for bot navigation. By analyzing the data, we identified spots where additional nav links were required to allow bots to traverse more effectively. This insight enabled us to improve bot movement and, in turn, enhanced the overall level flow, leading to more dynamic interactions between bots and players.
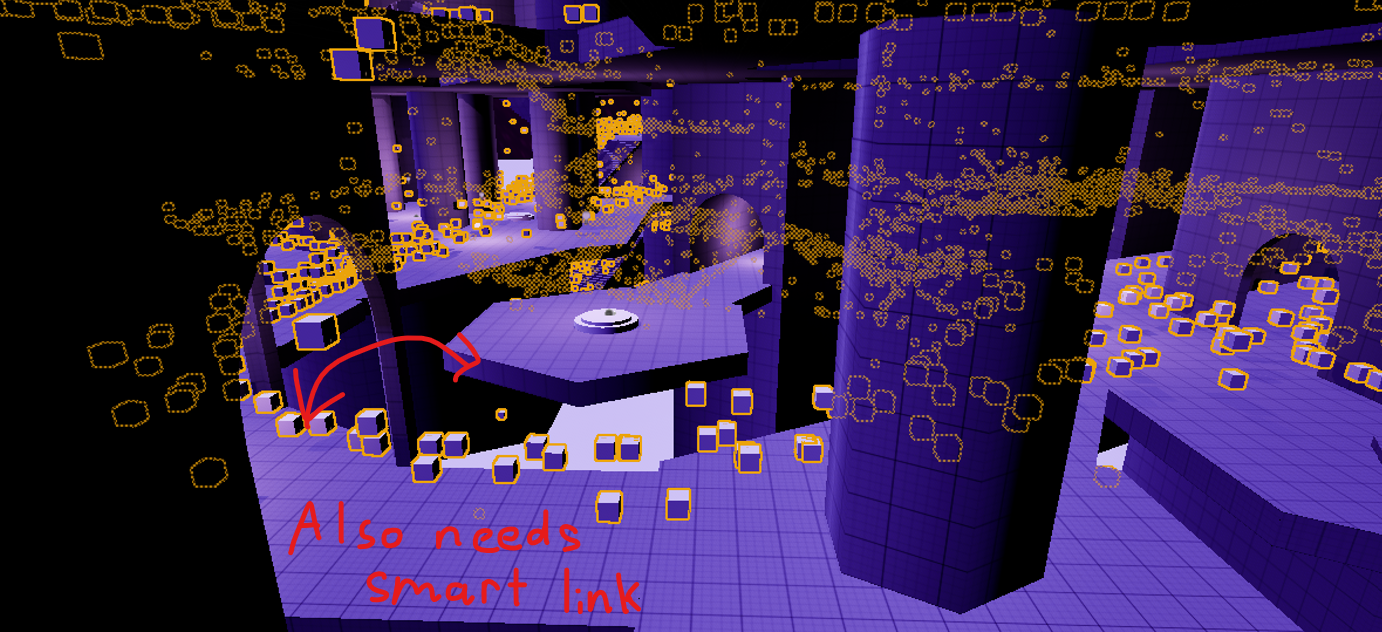
Telemetry Grouping
To be able to efficiently display telemetry in a heatmap, I created a scalable grid-based system with an indexing function that maps 3D positions into a 1D array of data structures using C++ and Blueprints. This allows level designers to adjust the overall grid size and individual cell sizes to meet level needs while enabling efficient data retrieval for generating heatmaps in the editor.
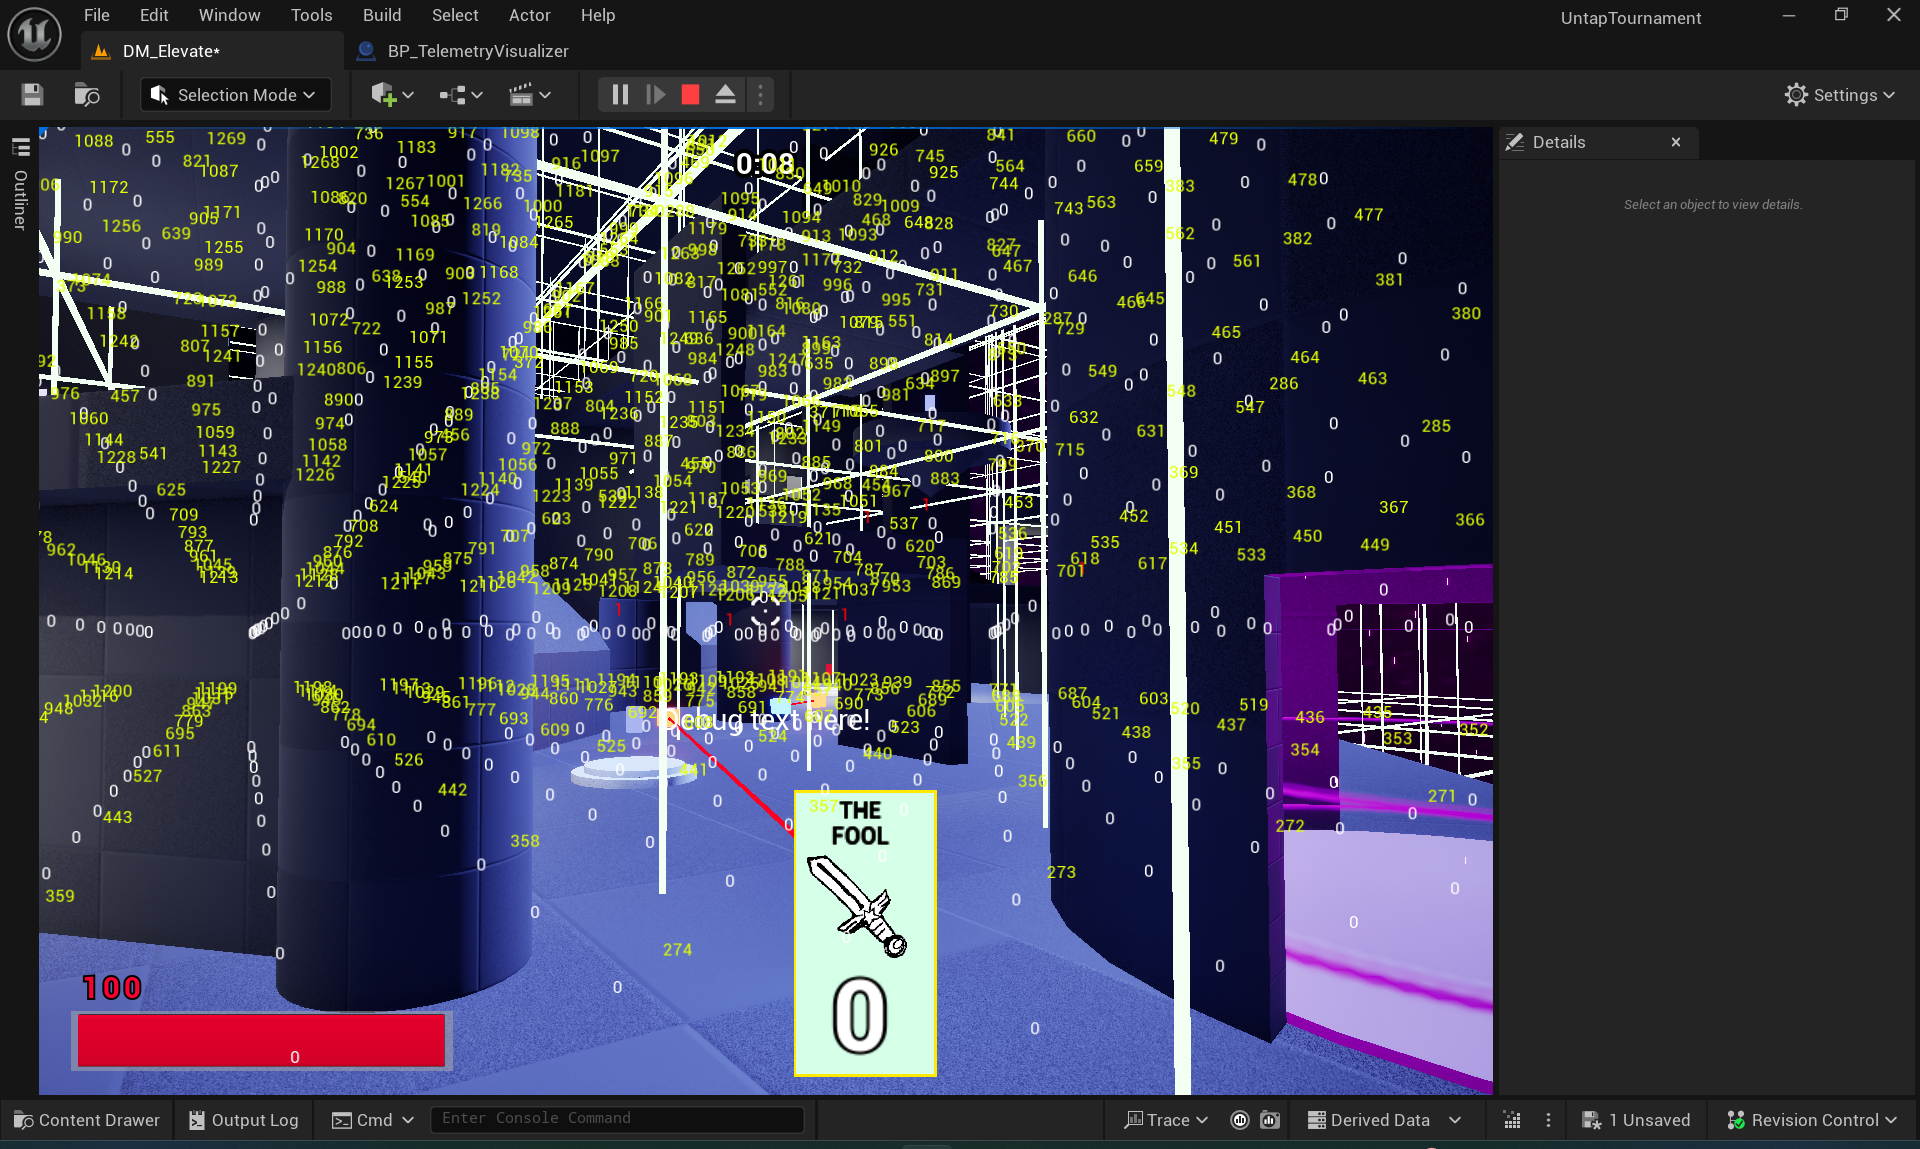
Kill & Death Heatmaps
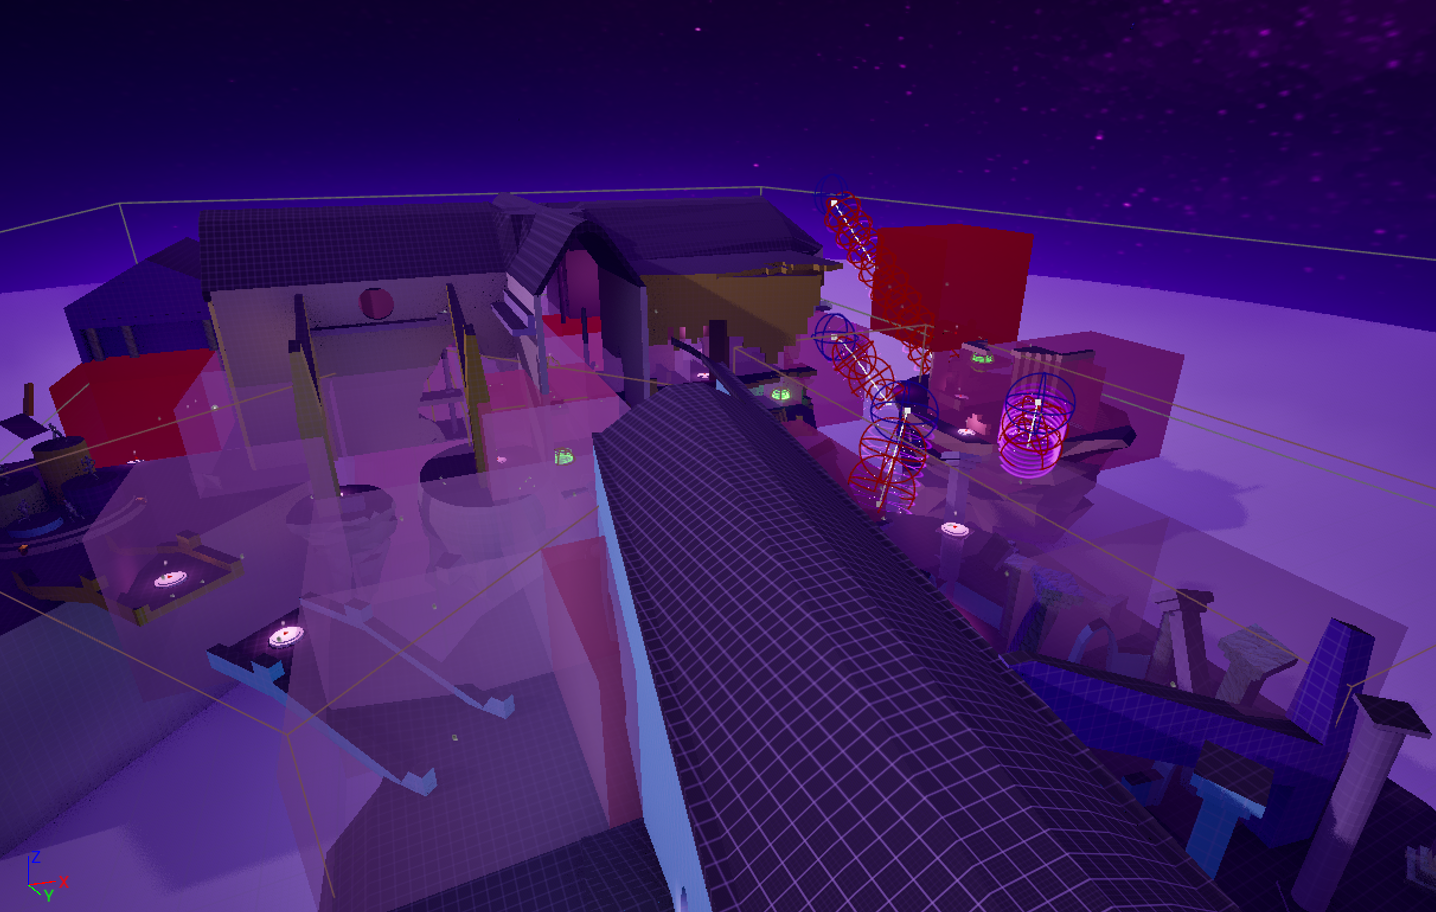
The victim and killer heat map offers a dynamic, scalable view of player interactions, highlighting areas with frequent deaths and concentrated kills. By feeding the data into a material and adjusting alpha for color and opacity, I highlighted kill and death zones, helping identify potential power positions or overly dangerous areas. This heat map offers valuable insights for informing level adjustments, ensuring balanced encounters and adherence to the intended level design.
Positional Heatmap
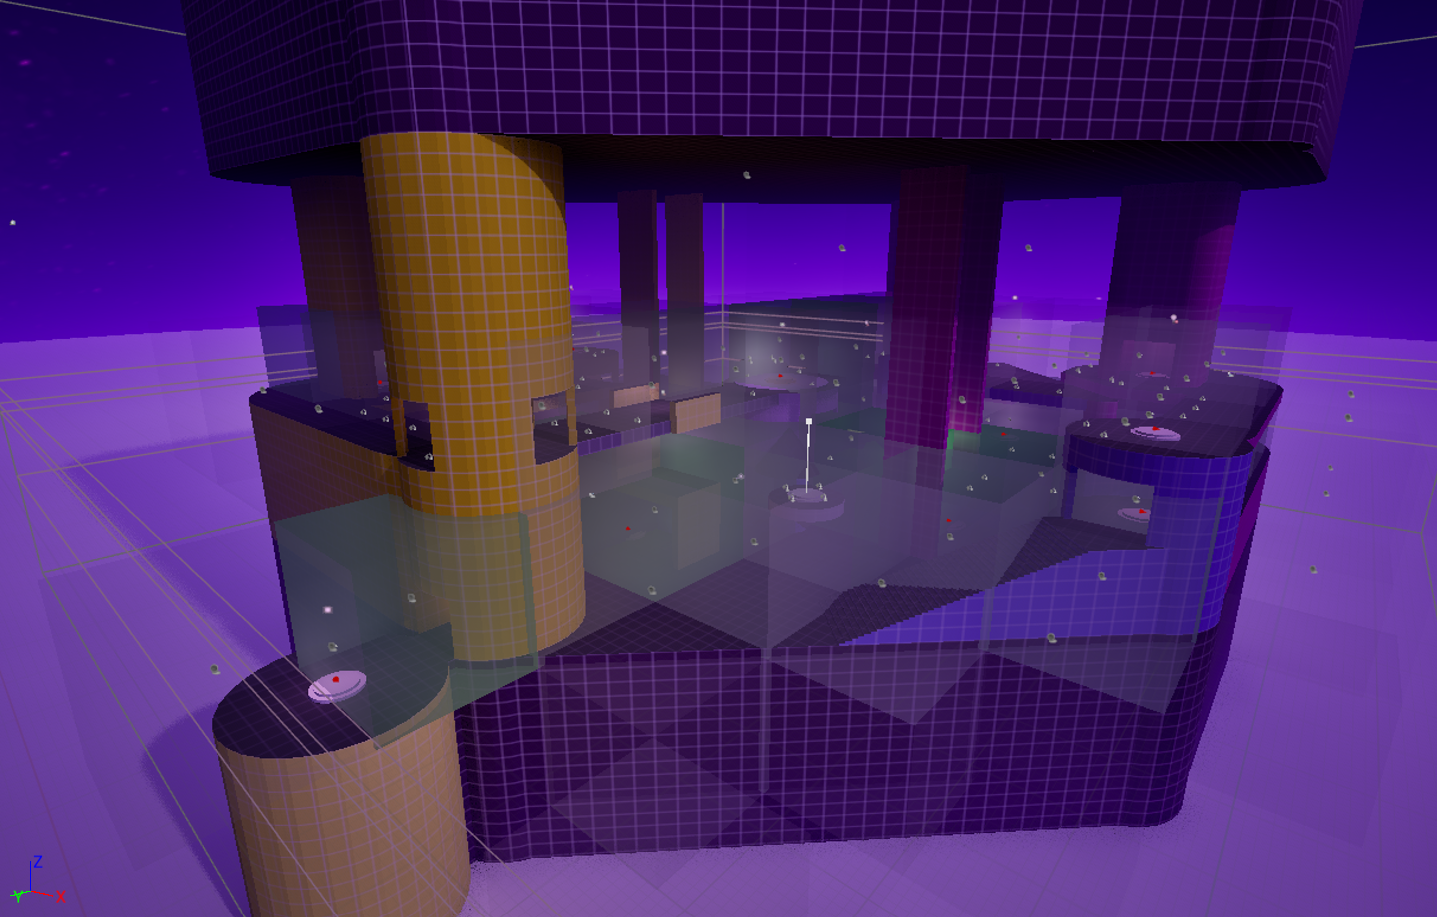
The positional heat map groups player and bot positions, offering insight into underutilized or overrun areas and paths. By feeding position data into the material’s alpha channel, areas with higher foot traffic become darker, helping to visualize where players may naturally converge. This is especially useful for identifying power positions and detecting where specific players might be camping by filtering data by player names for a given match.
Optimizing Levels for Client FPS
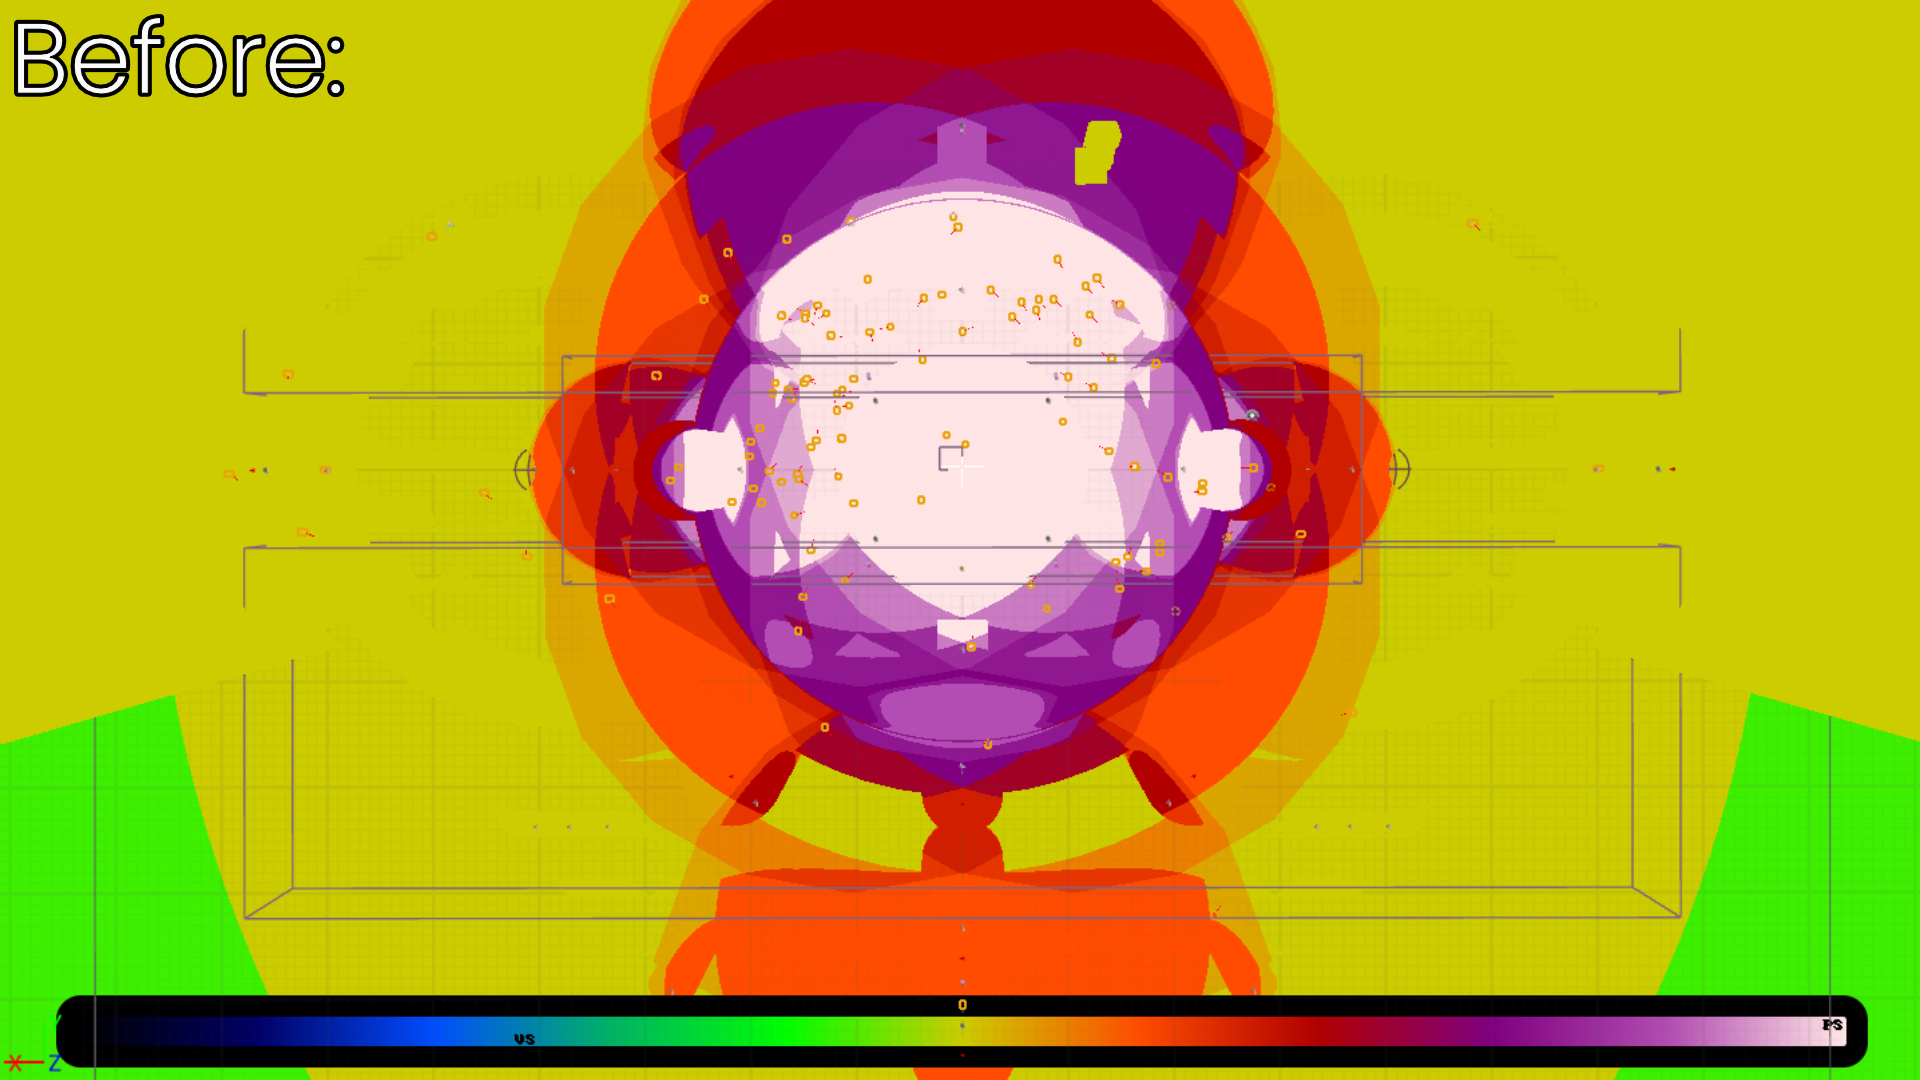
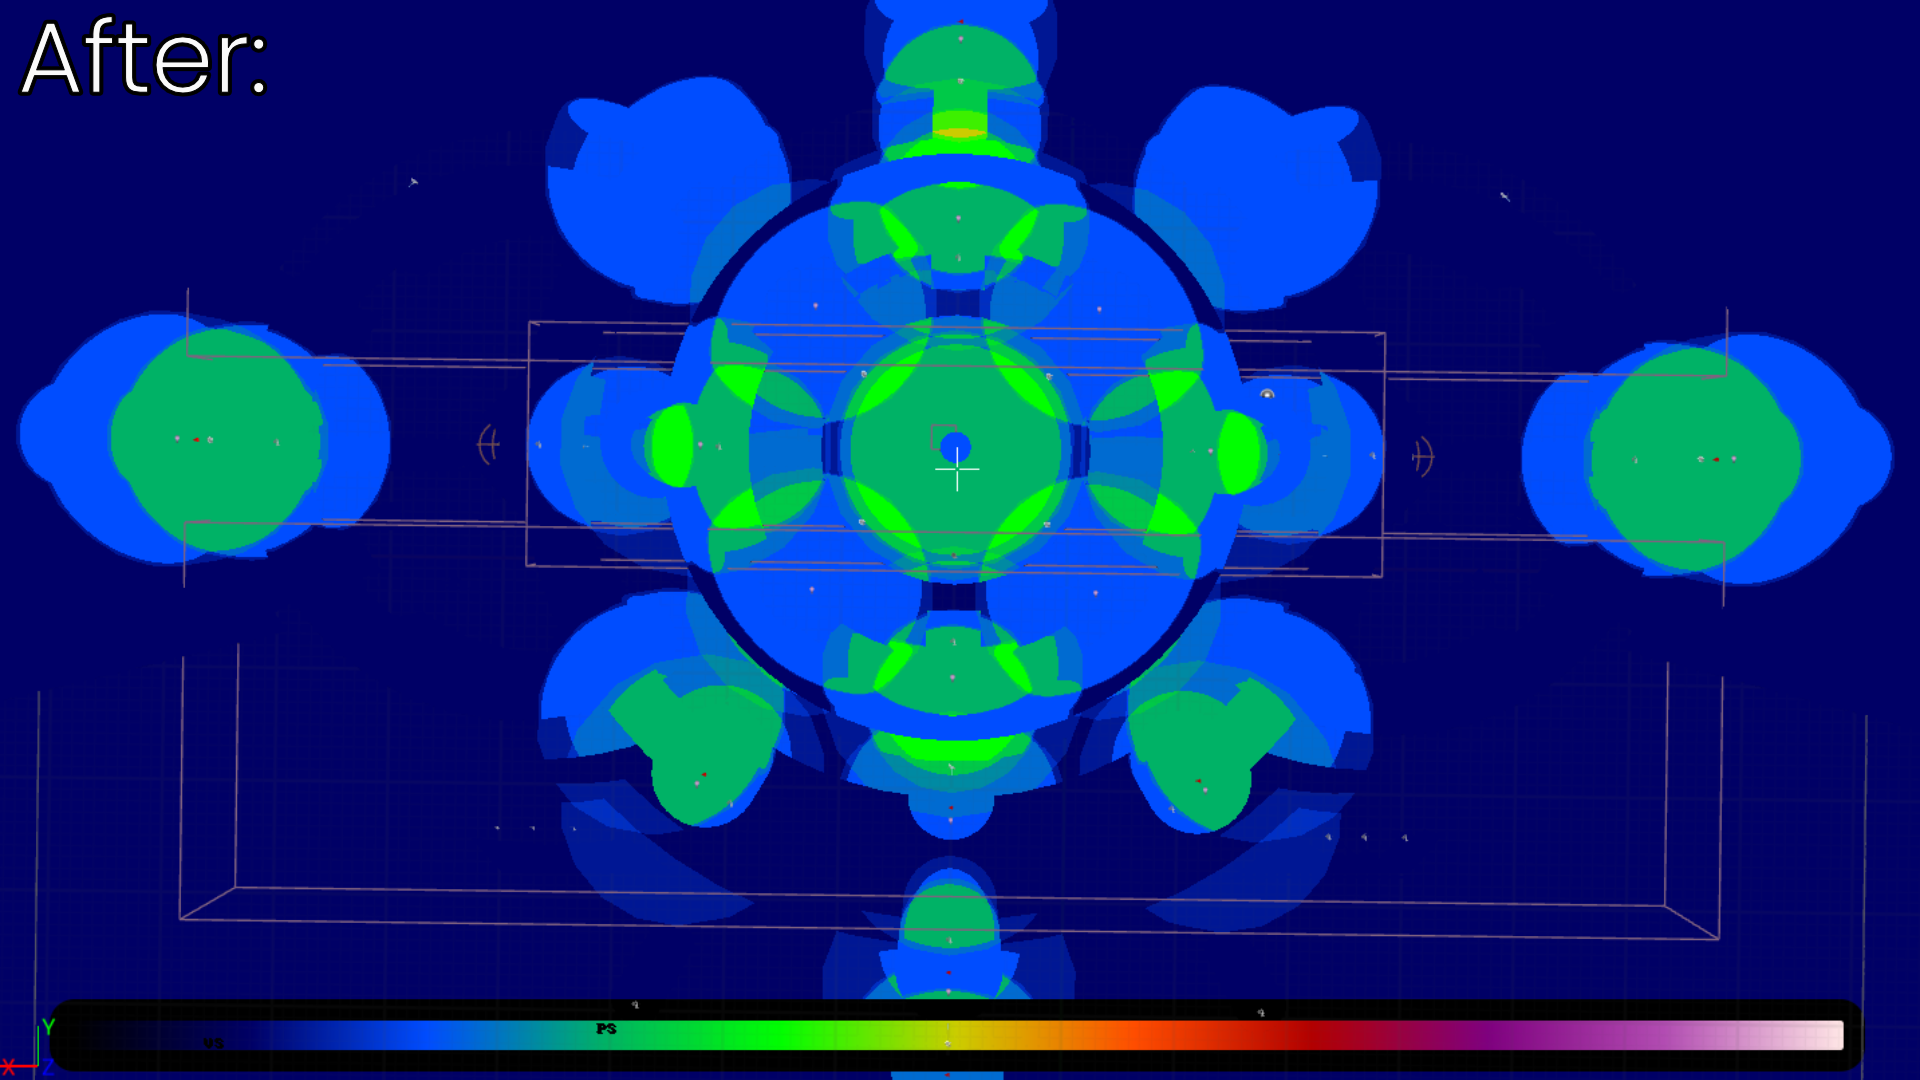
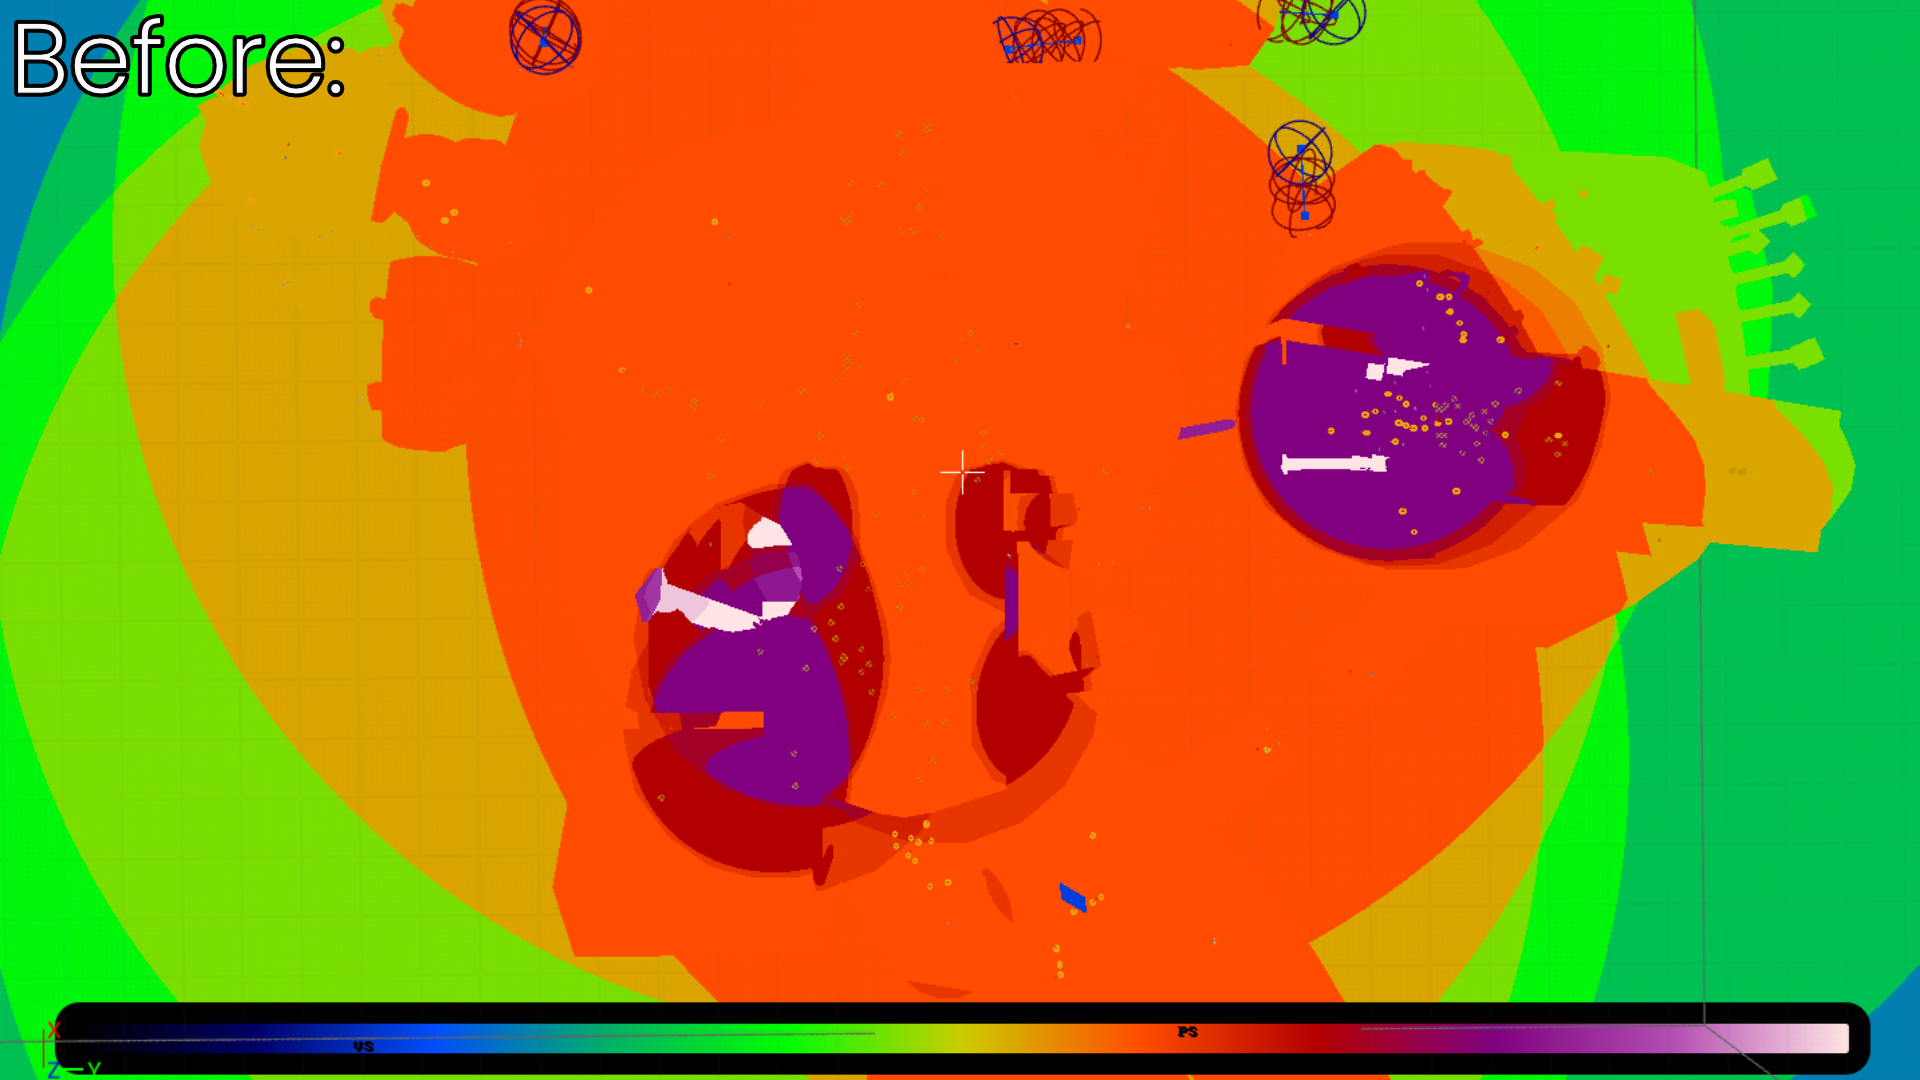
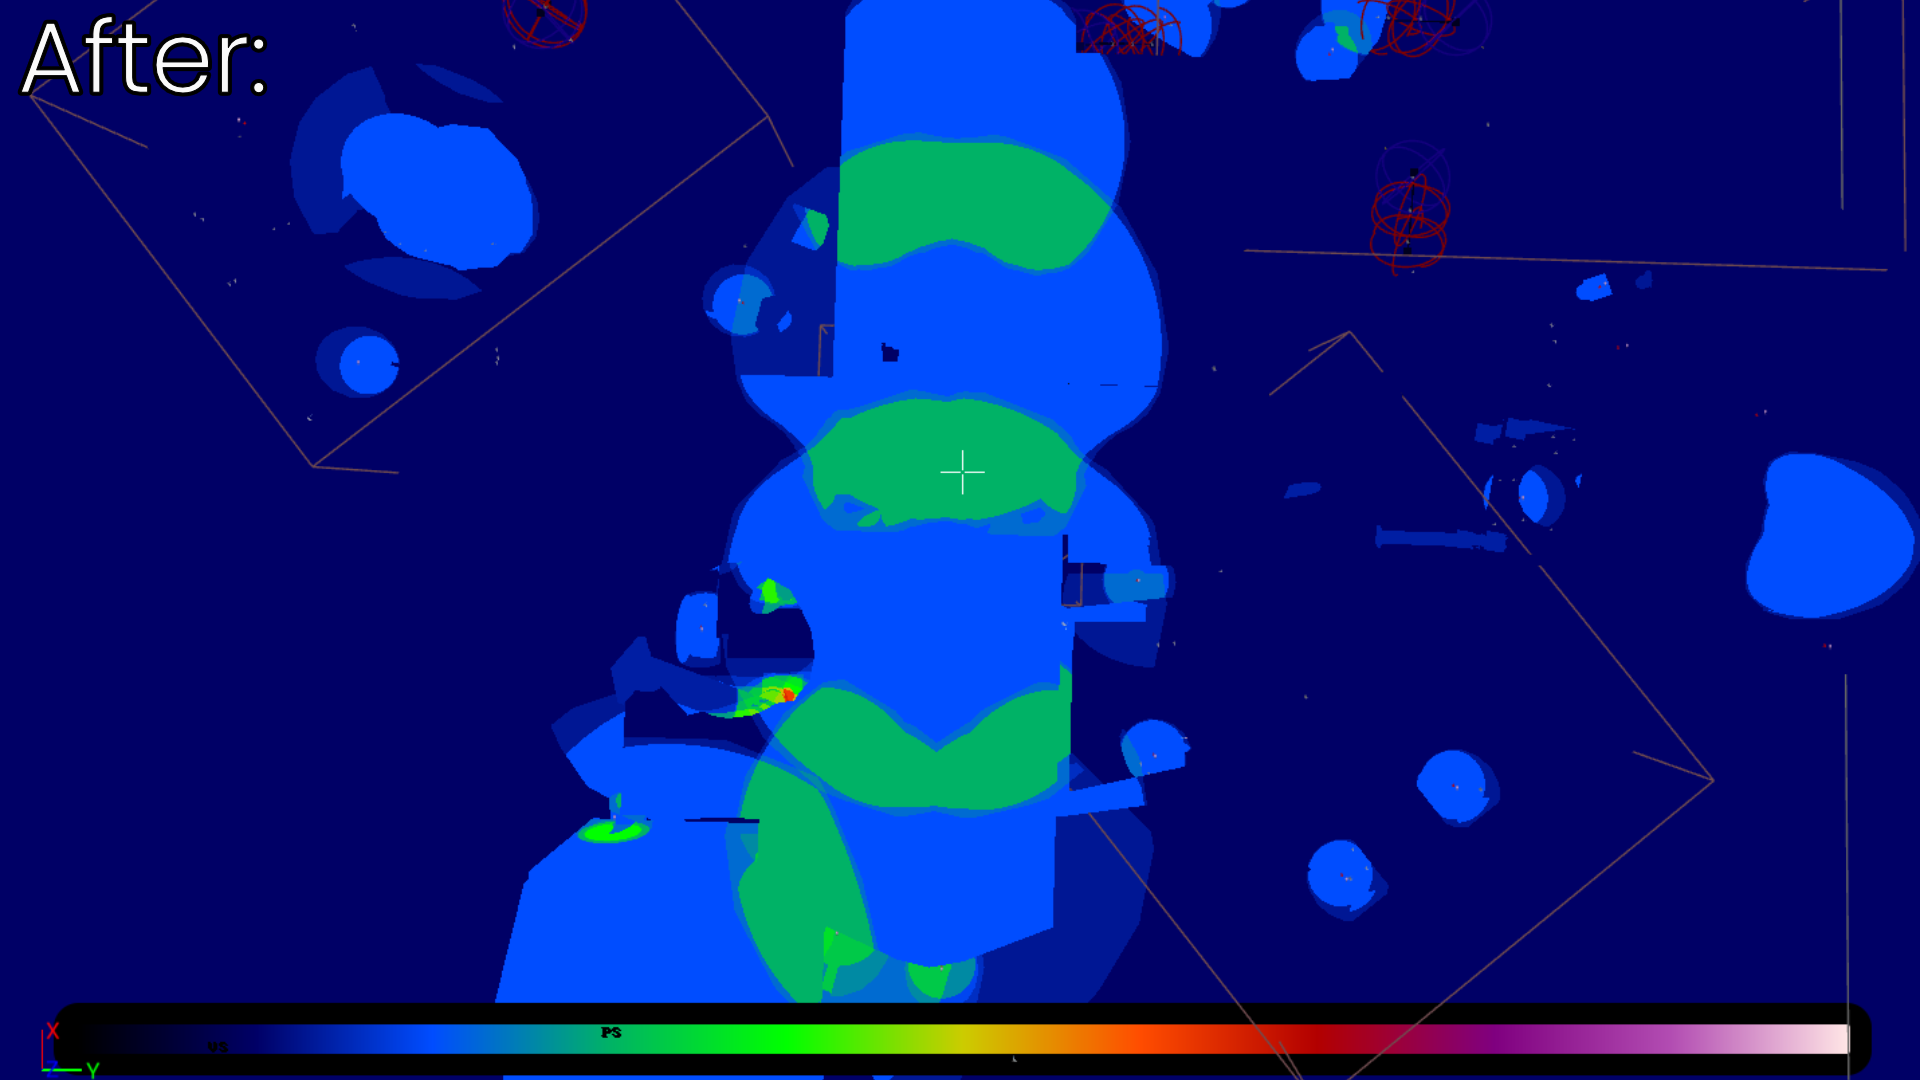
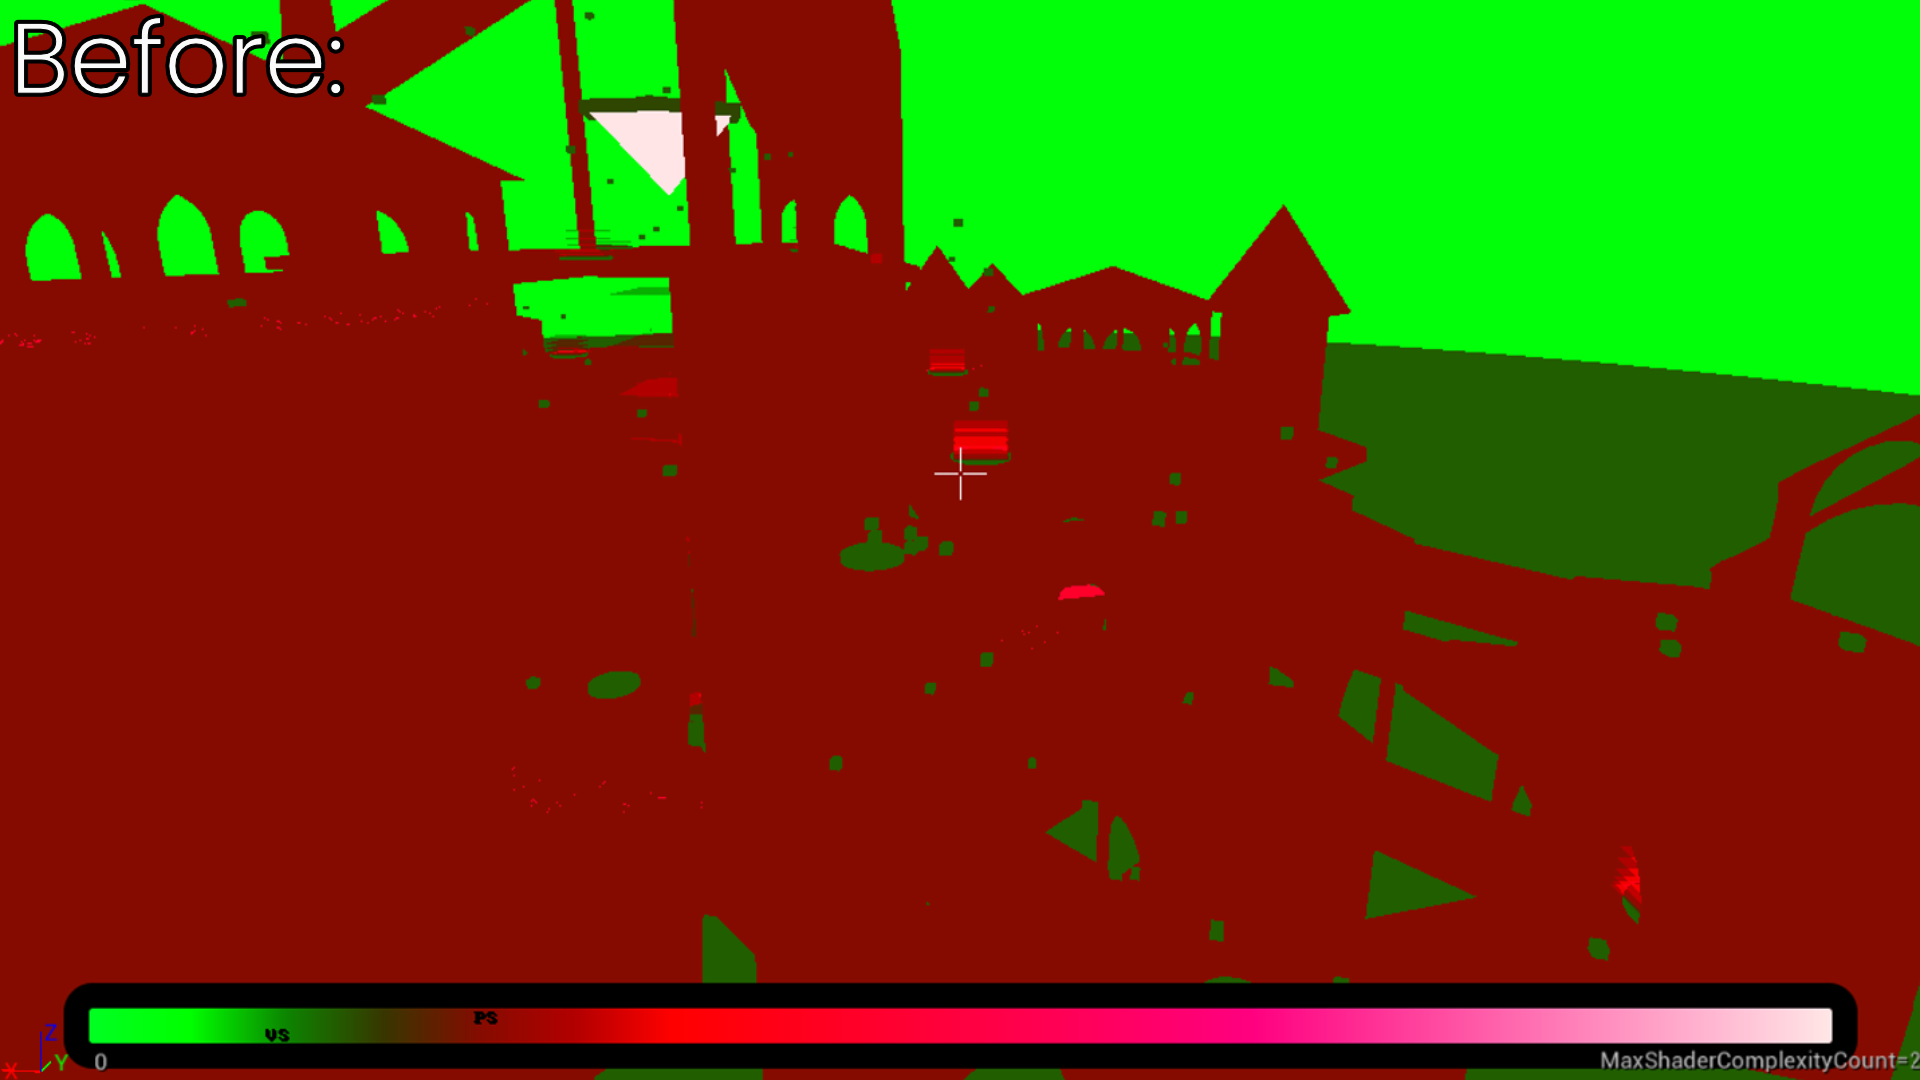
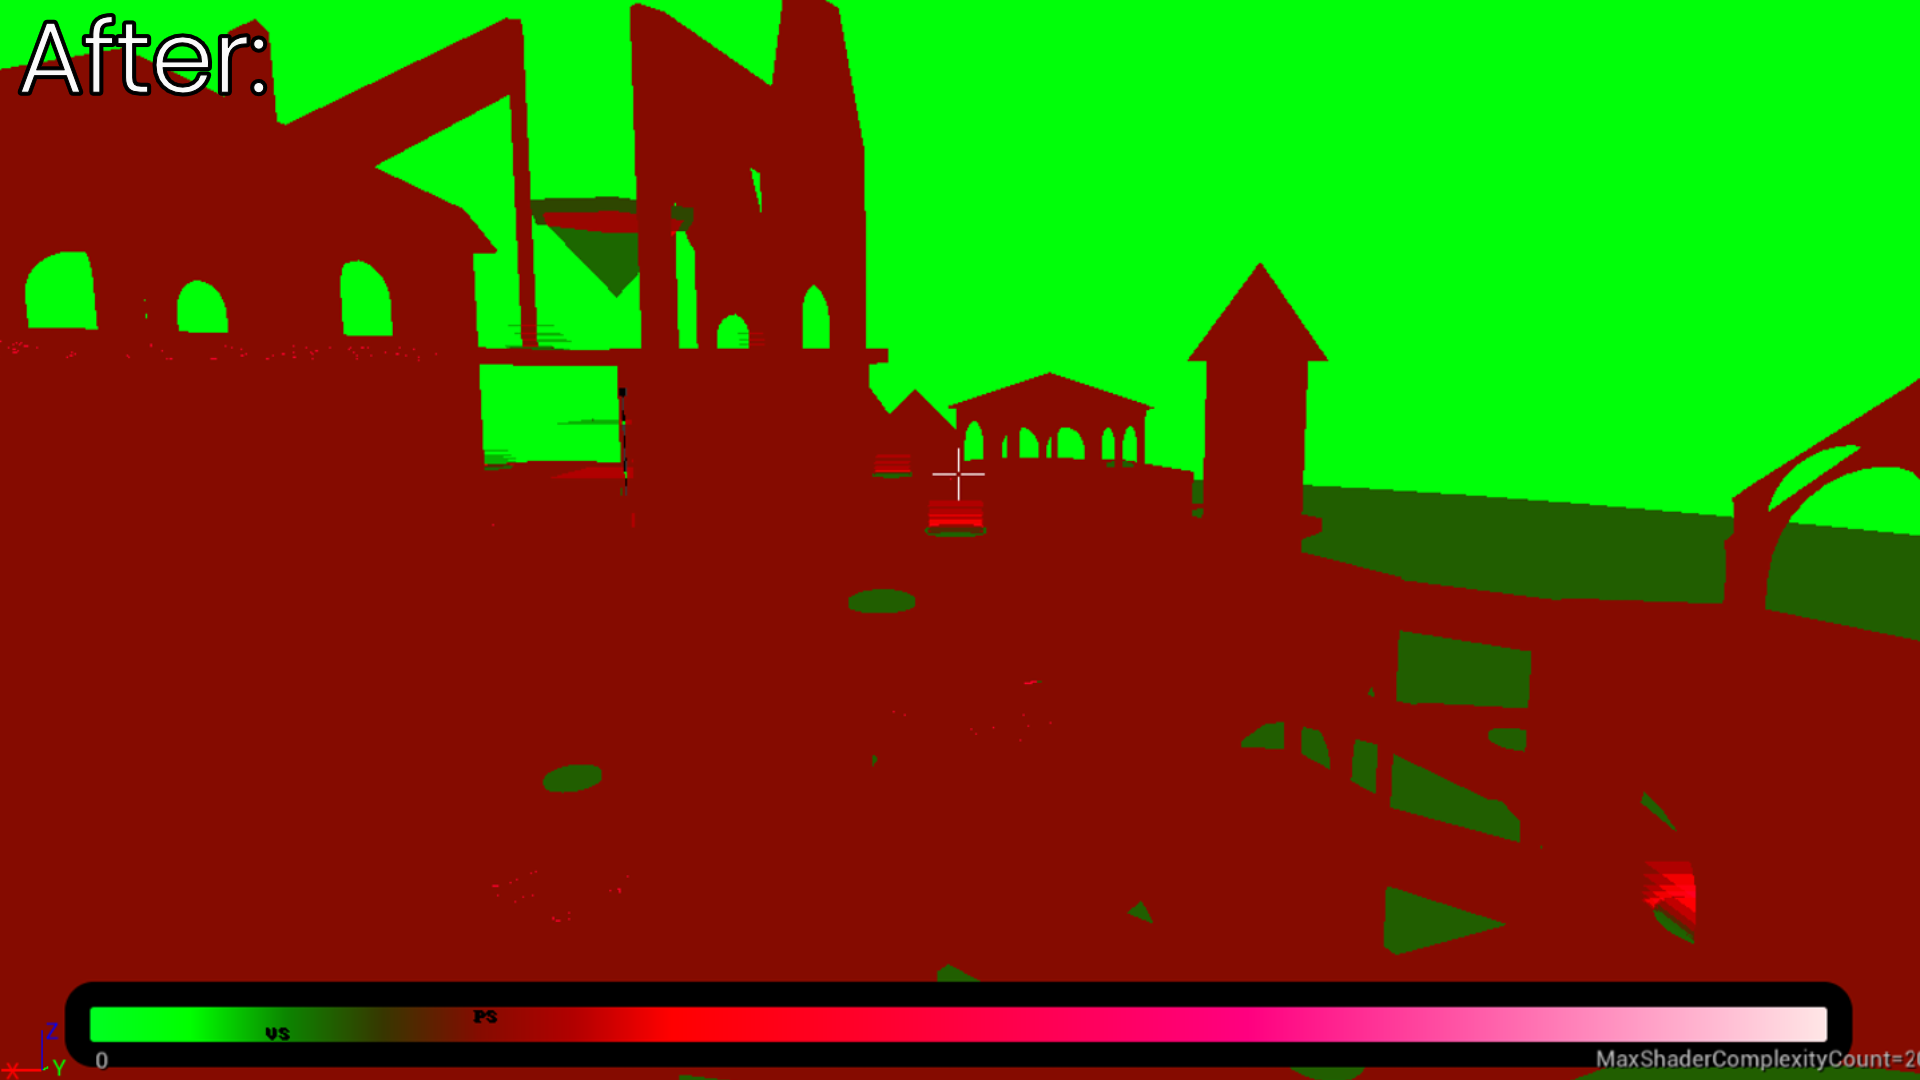
While working on the positional telemetry visualizer, I realized that adding client FPS data alongside player positions and facing could provide valuable insights for performance optimization. Since I was already collecting other key data at regular intervals for visualization, incorporating this extra layer was relatively simple. After running large-scale 7-player playtests on each map, I filtered the data to focus on the lowest 5% of FPS per client, which proved more effective than using mean or median FPS per client in identifying performance bottlenecks. This approach enabled us to pinpoint areas in need of optimization, particularly with lighting and shader usage in our levels.
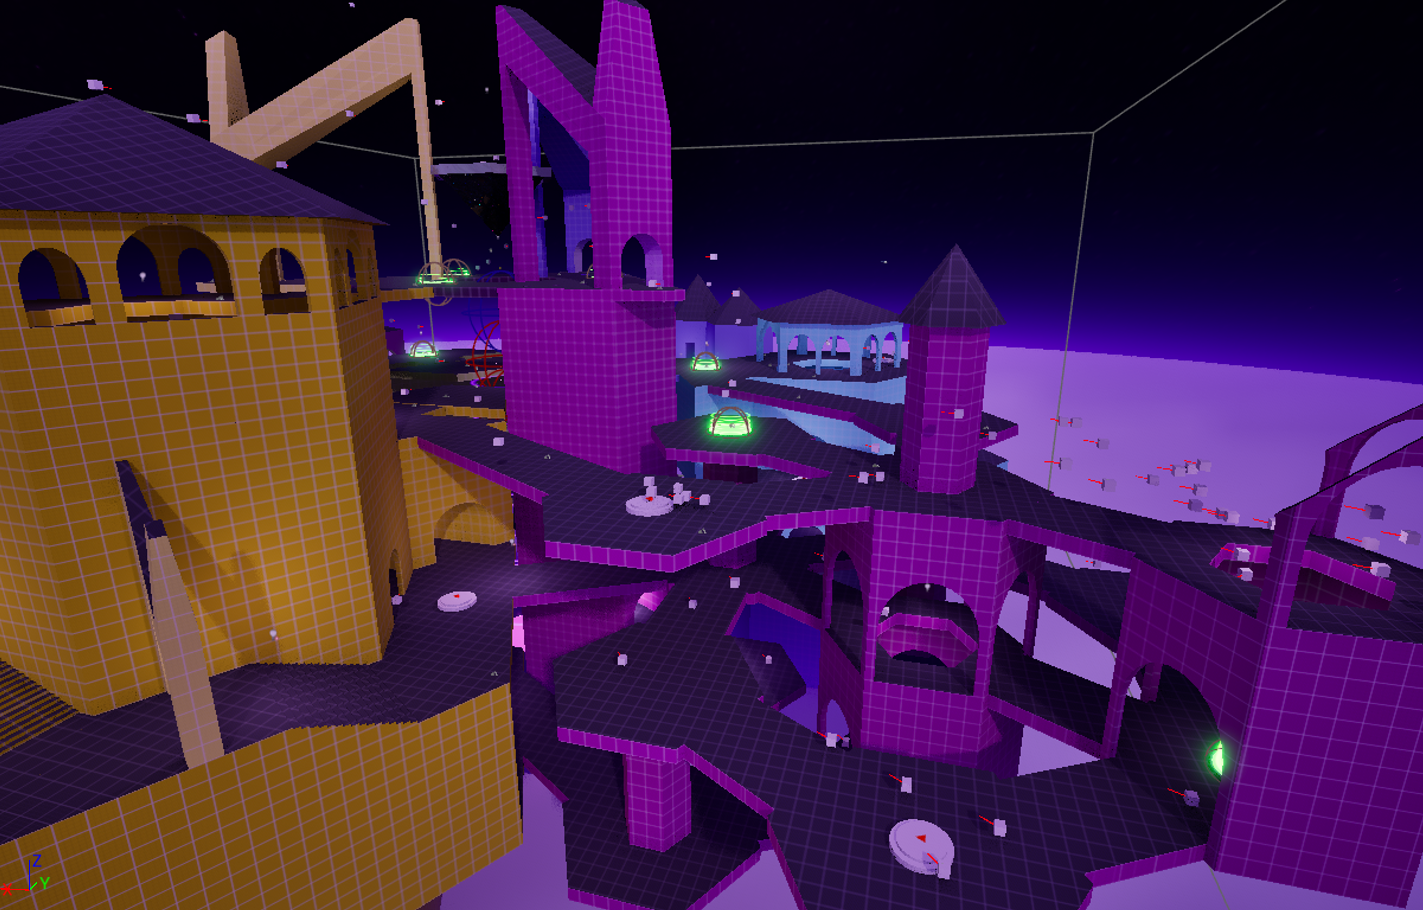
Filtering the lowest 5% FPS per client revealed consistent slowdowns near the center of DM_Divinity. Seeing that players faced all directions in this area ruled out the central rotating platform, leading to an investigation of lighting, which turned out to be the cause.
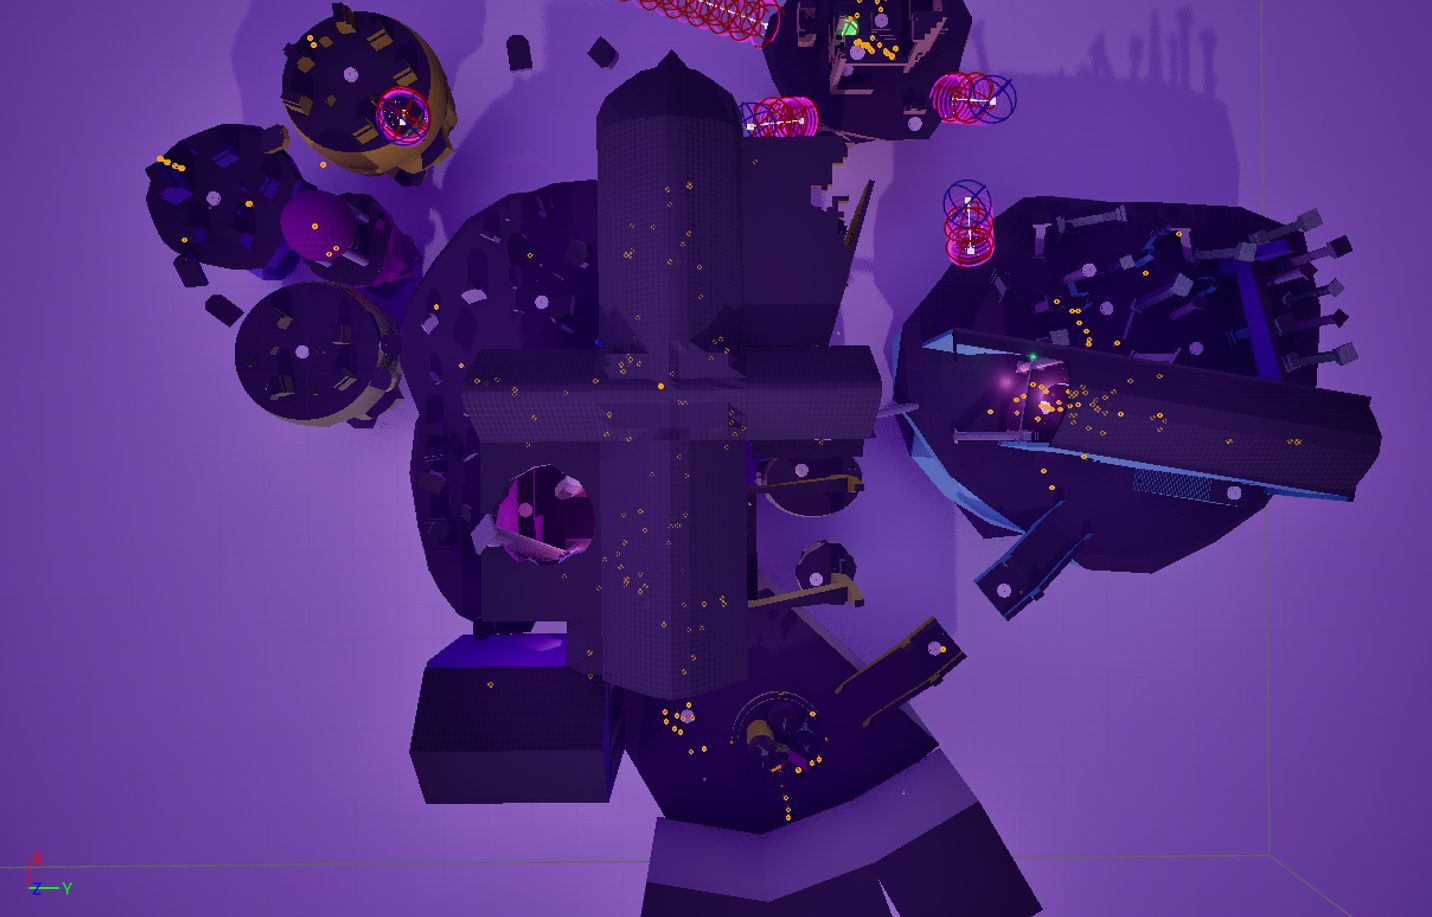
For DM_Apotheosis, FPS drops weren’t as noticeable during playtests, but the tool revealed clusters of low FPS scattered across the map. Filtering the data showed consistent low client FPS in specific areas, leading us to investigate lighting—confirming it as the main cause of the performance issues on this map.
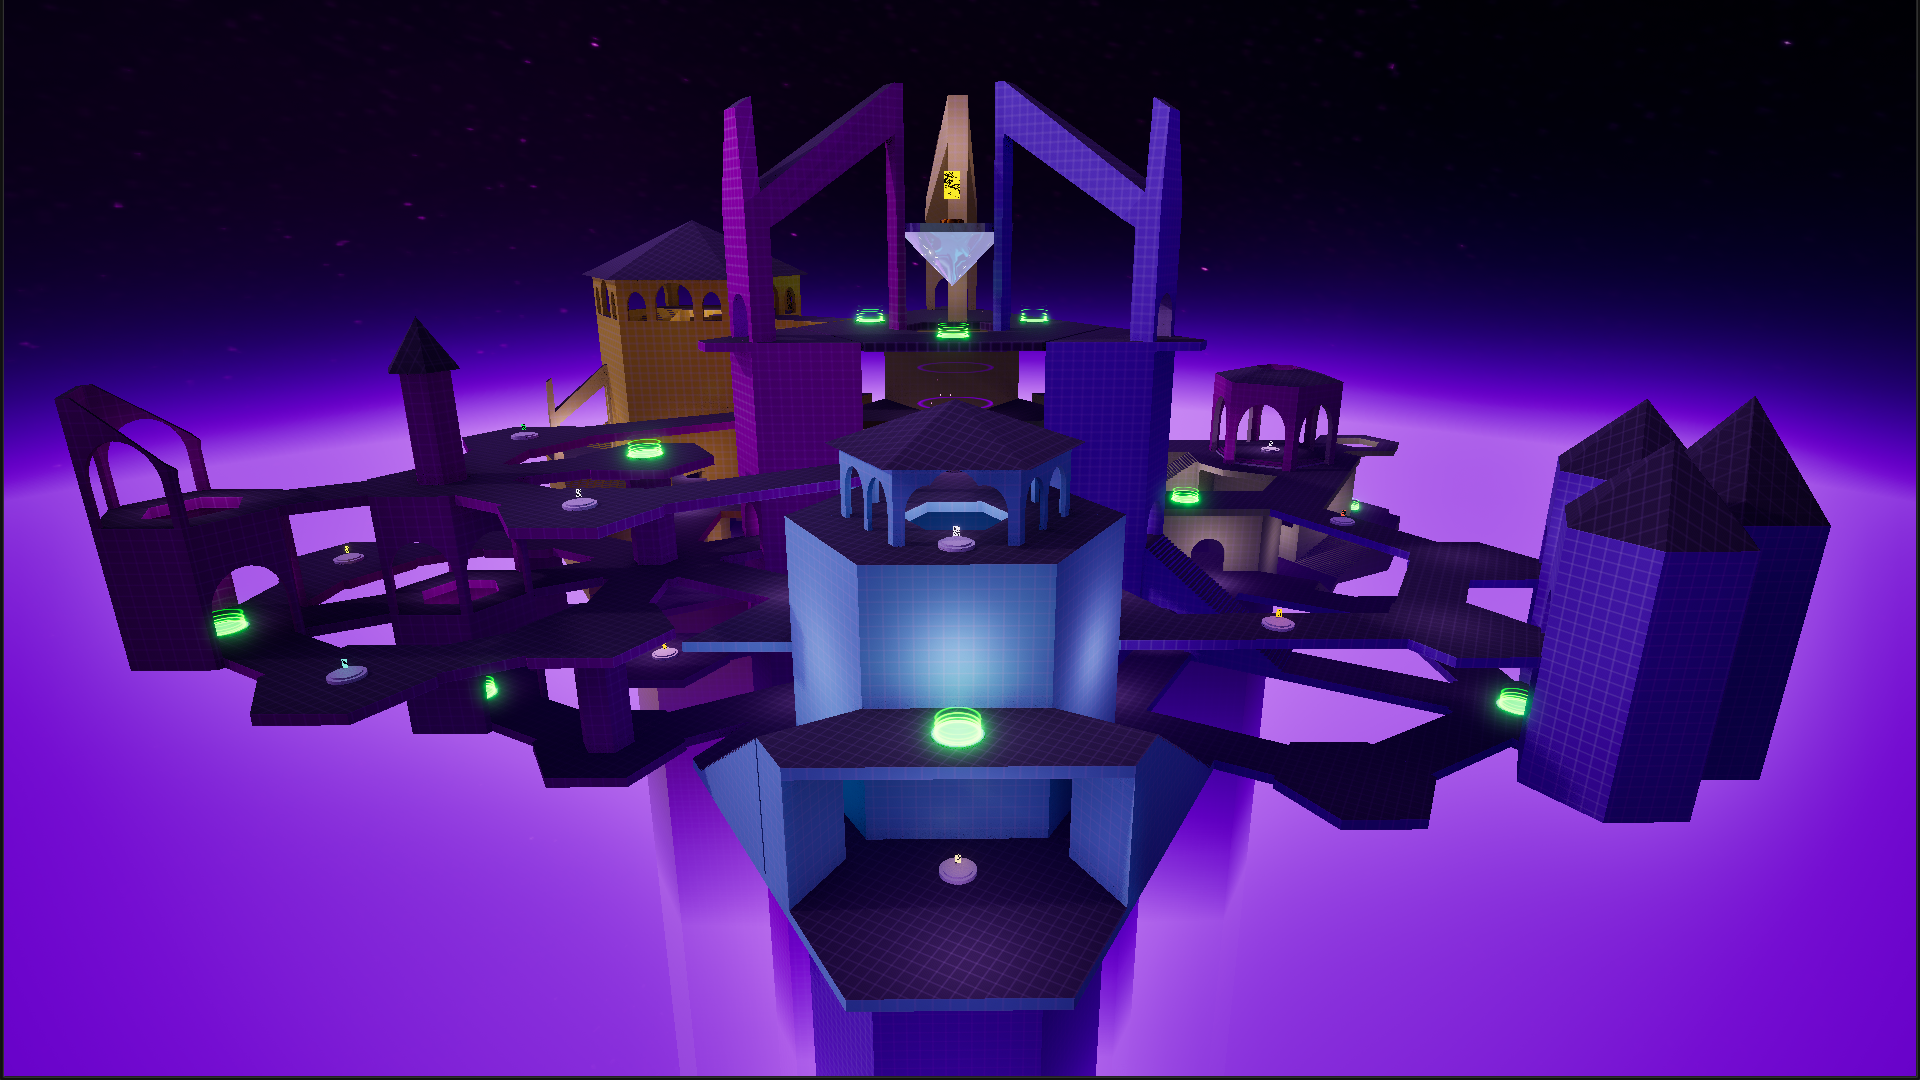
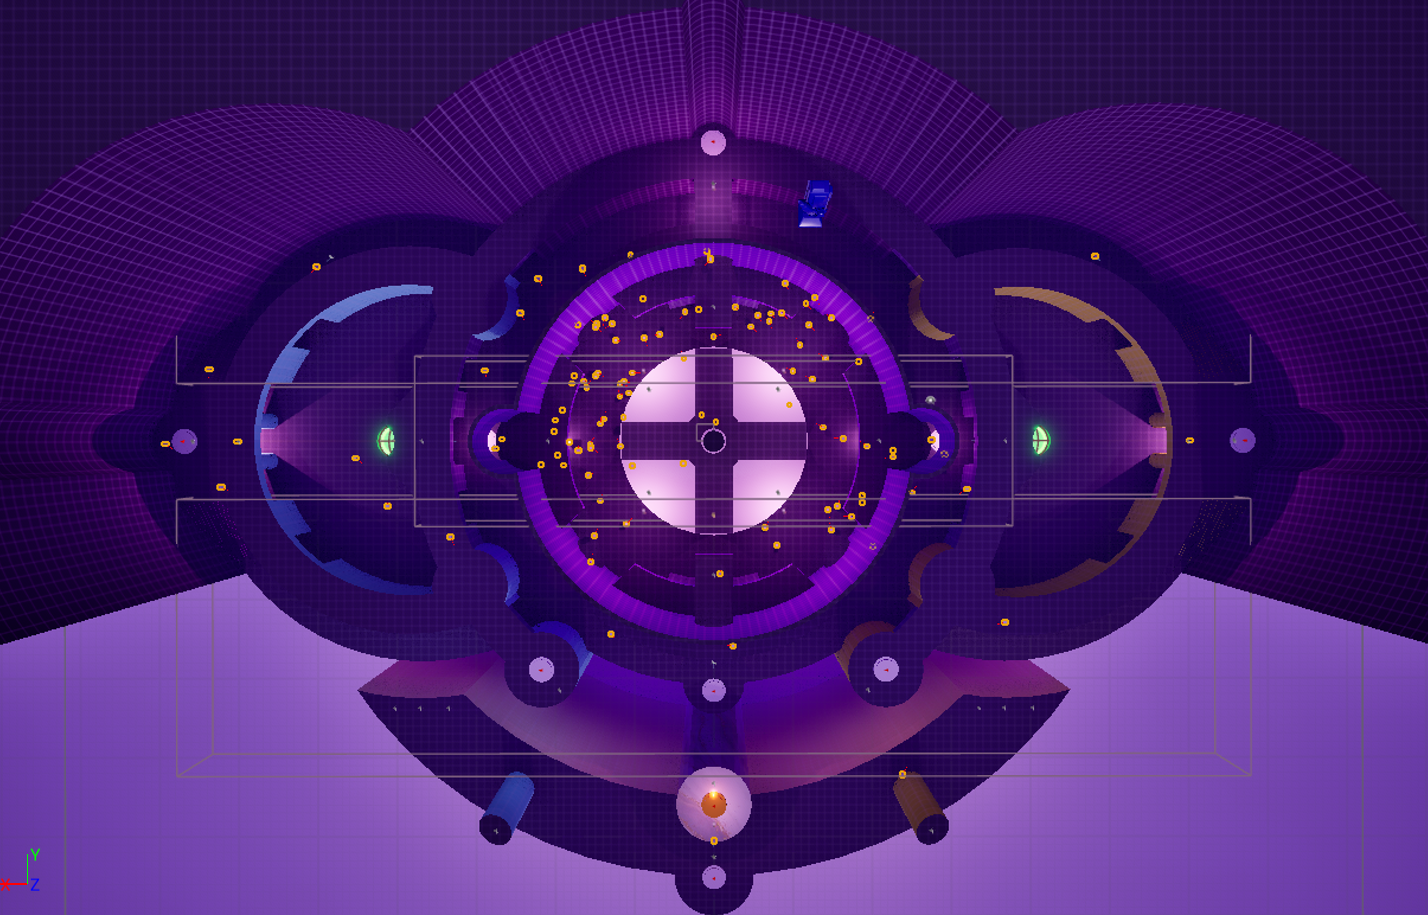
In one particular match on DM_Transcendence, many players reported low FPS when trying to grab the power weapons. By analyzing the telemetry data, we used the low client FPS filter and player facing visualization to trace the issue to a material at the center of the map, below the spawner. The shader, which used Nanite, was confirmed as the main cause of the performance drop.
